Kibana email alert - extracting field results

Hi everyone,

I’m using a windows based Opendistro Kibana installation.
In Kibana, I configured a custom Webhook in order to send email alerts using an SMTP server.
Email alerts are being sent and it’s working perfectly so far.

What I didn’t quite understand (after following the documentation) is how to extract a specific field from a specific index and display the result in the email alert message.
For example,
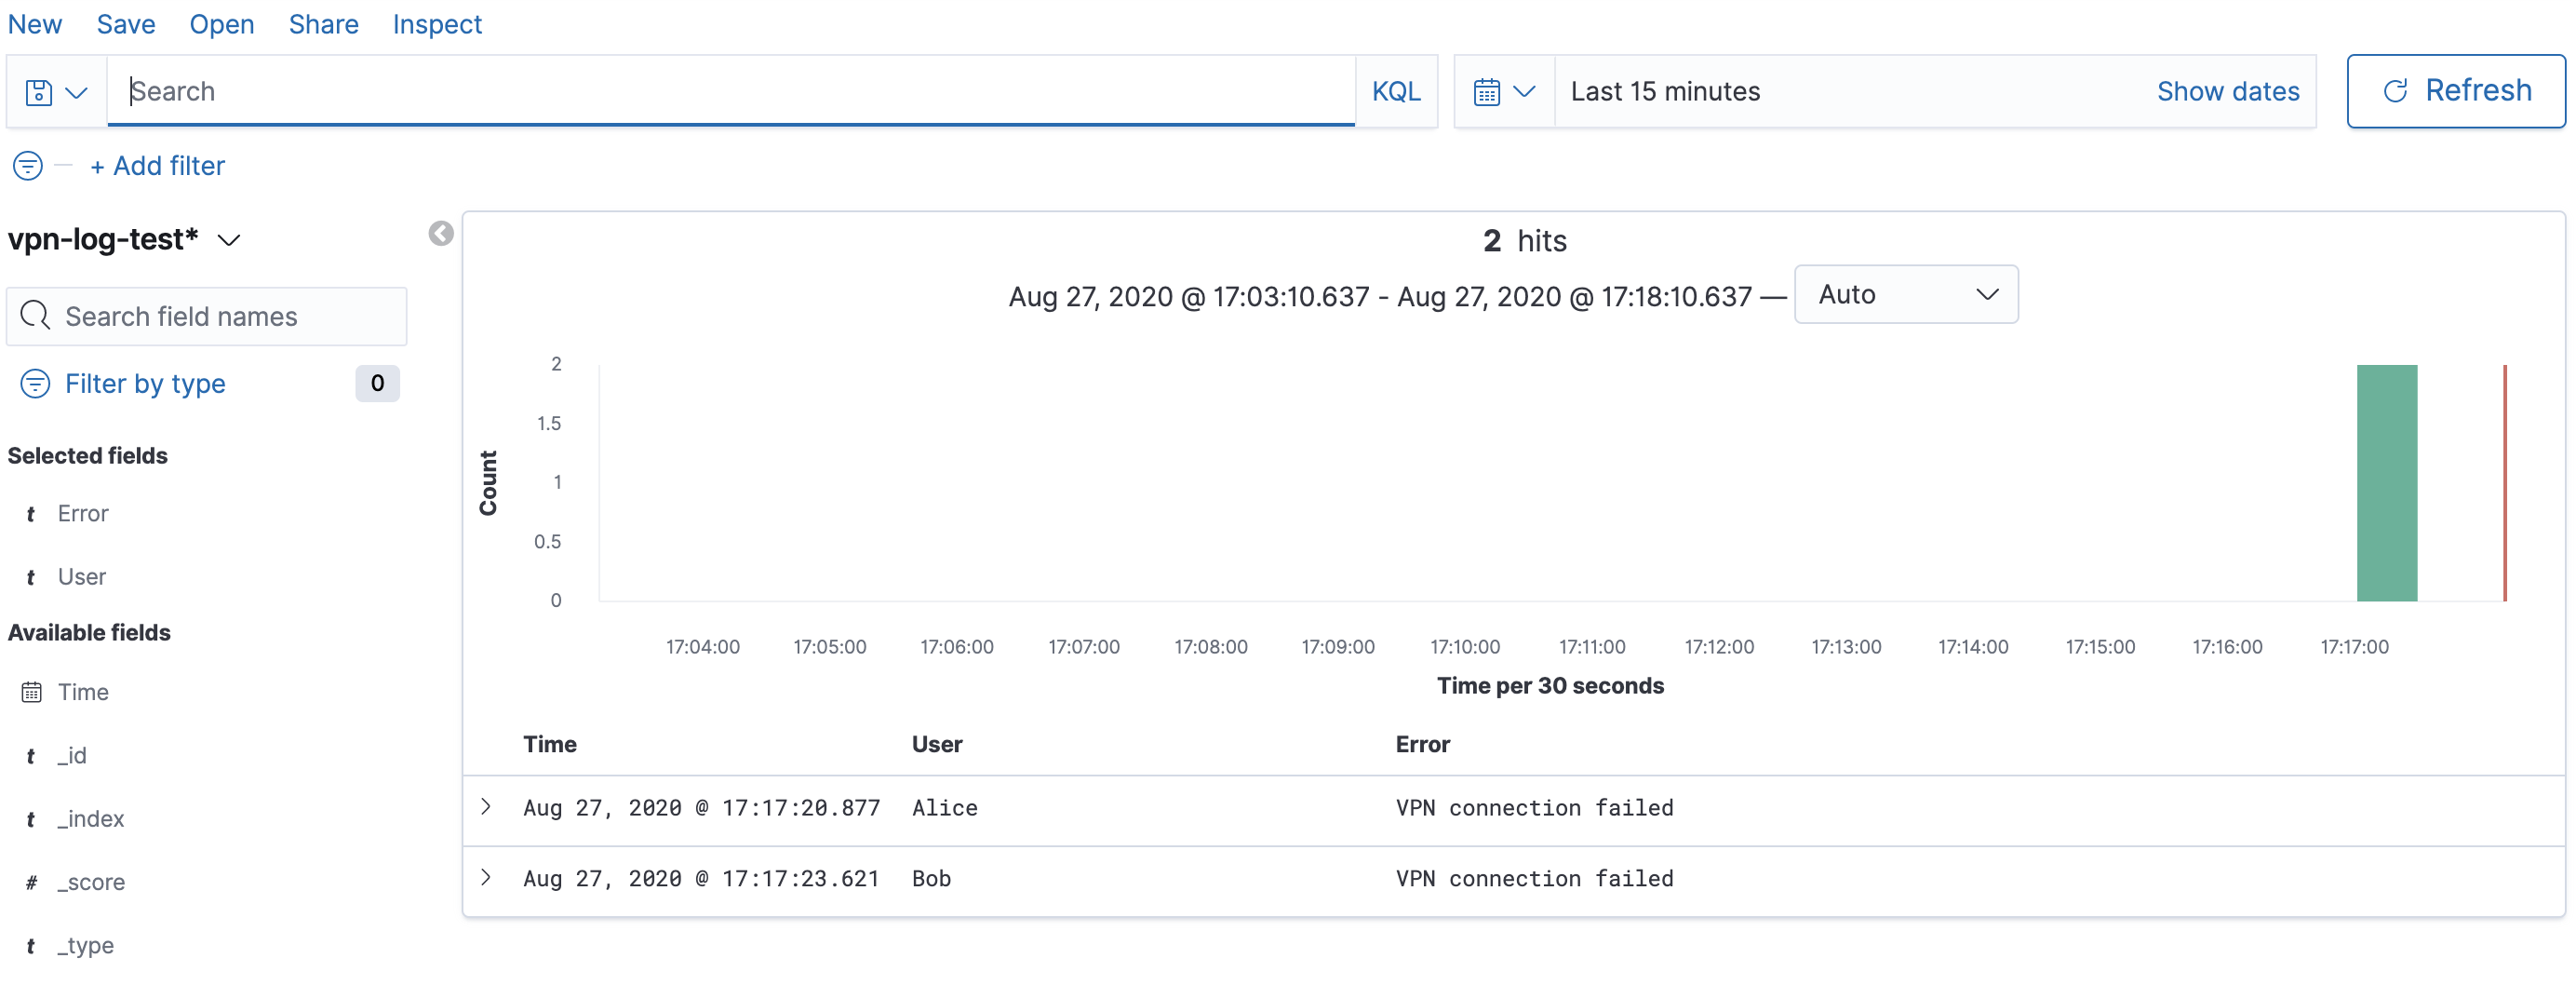
I’m trying to trigger an alert for a failed VPN login and show the username field in the email alert message.

The index name is:
vpn*

The field under “_source” that I need to display it’s result is:
user

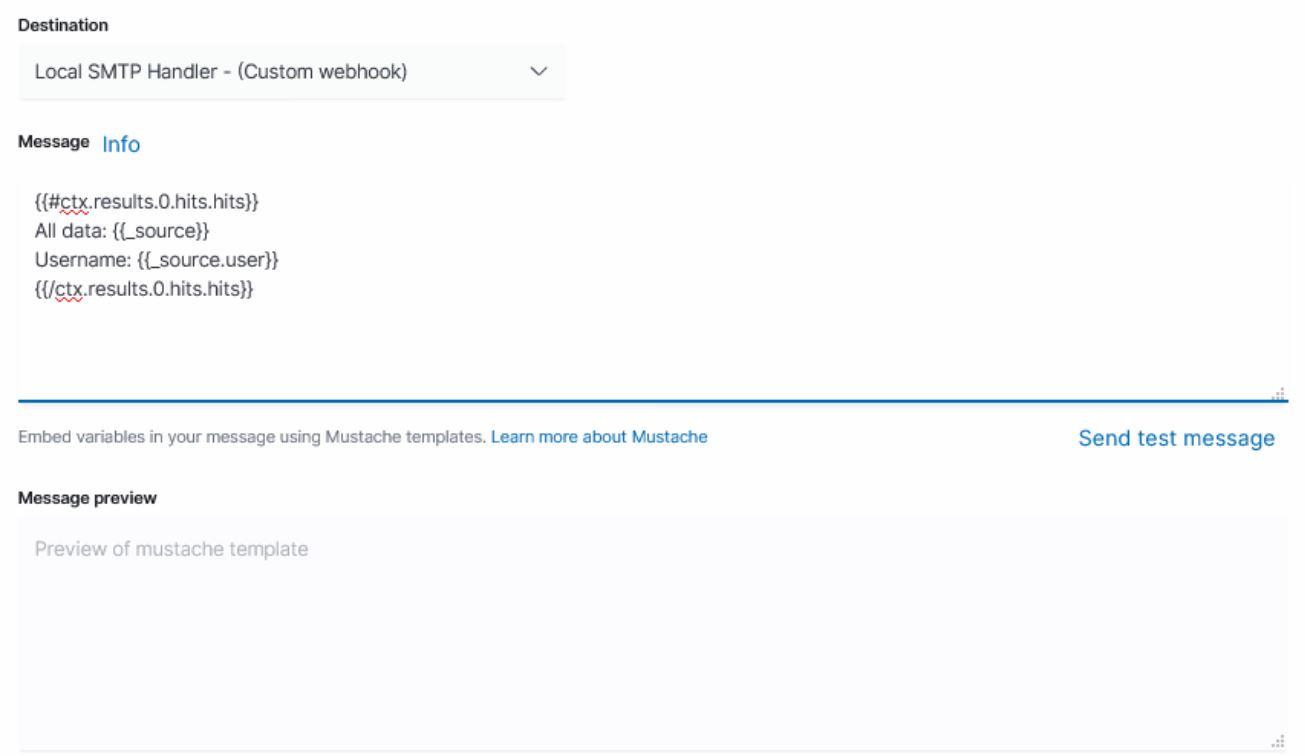
My trigger message includes:

  • Monitor {{ctx.monitor.name}} just entered alert status. Please investigate the issue.
  • Trigger: {{ctx.trigger.name}}
  • Severity: {{ctx.trigger.severity}}
  • Period start: {{ctx.periodStart}}
  • Period end: {{ctx.periodEnd}}
  • Error: {{ctx.error}}

What I’ve added:

  • Username: {{ctx.results.0.hits.hits.0._source.user}}

But it’s obviously doesn’t work, it shows a blank result on both “Username” and “Error”.

What am i missing?

Your help would be much appreciated!

Thanks in advance, hoping to be able to do the same in the near future.

Best regards to all.

2 Likes

Hello @lehner.angelica
We also started to use Alerting in Kibana but with Slack. For message body we use the following code:

> Period {{ctx.periodStart}} - {{ctx.periodEnd}}
> Errors Count: {{ctx.results.0.hits.total.value}}
{{#ctx.results.0.hits.hits}}
> {{_source.ObjectID}} - {{_source.Module}} - {{_source.MessageID}}
> {{_source.ErrorMessage}}
{{/ctx.results.0.hits.hits}}

Where ObjectID, Module, MessageID and ErrorMessage are fields of the index.

What do you see if use

{{#ctx.results.0.hits.hits}}
Error: {{_source.error}}
Username: {{_source.user}}
{{/ctx.results.0.hits.hits}}

Hey @stmx38!

Thank you for the quick reply.

I tried using your suggestion:

{{#ctx.results.0.hits.hits}}
Error: {{_source.error}}
Username: {{_source.user}}
{{/ctx.results.0.hits.hits}}

But unfortunately, I did not get any result (blank).
The error is less important, the user is so i also tried:

{{#ctx.results.0.hits.hits}}
Username: {{_source.user}}
{{/ctx.results.0.hits.hits}}

No luck :confused:

Just tried in our Kibana and see the following in the Trigger condition response: on the ‘Edit trigger’ page

No trigger results

And as a result my preview is blank too. Does your Monitor with defined conditions return any data for the moment when you try to preview the message?

Maybe we should increased the period in the Monitor on order to get ‘hits’ and to see any data in preview?

Yes,
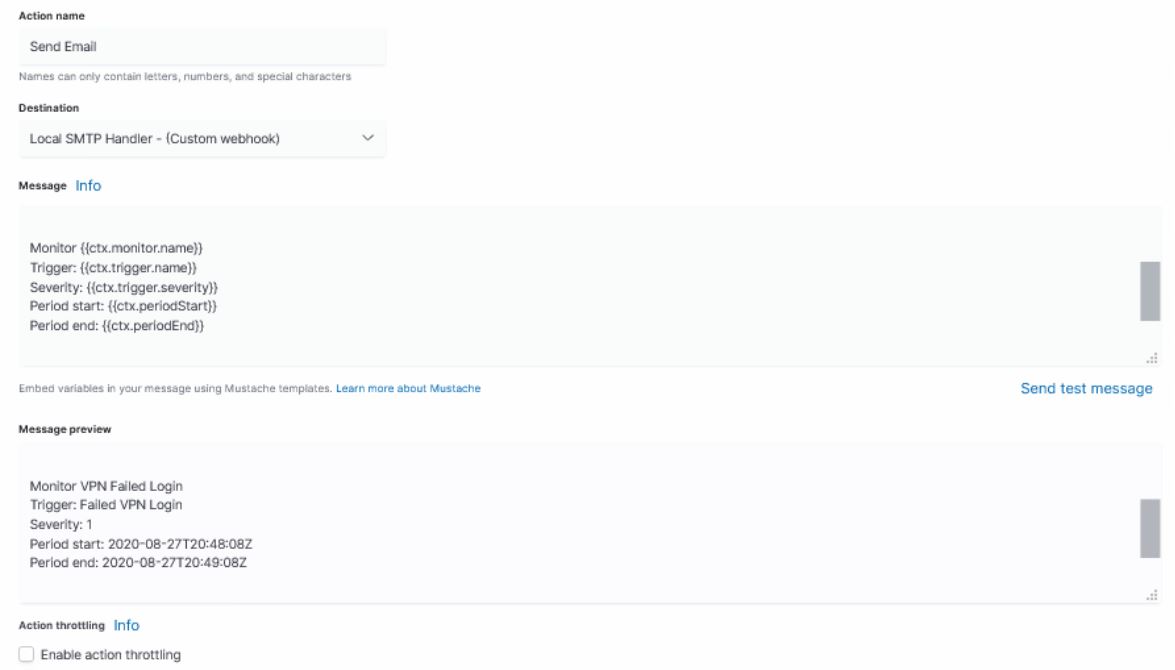
On the preview pane, I get the following (defaults) with data:

Monitor {{ctx.monitor.name}}
Trigger: {{ctx.trigger.name}}
Severity: {{ctx.trigger.severity}}
Period start: {{ctx.periodStart}}
Period end: {{ctx.periodEnd}}

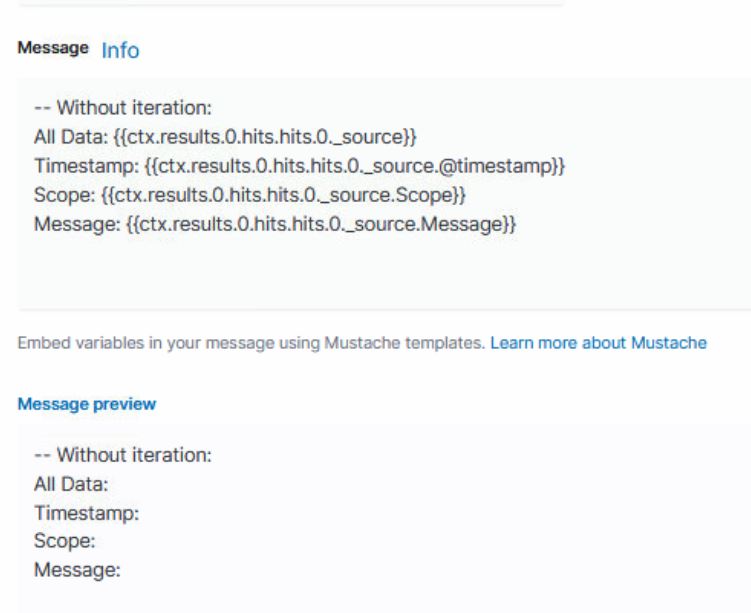
But once I try to get data out from _source, It’s blank.
I’m not sure if increasing period in the Monitor would help since it’s triggered by a specific action (above 1) but i’m only assuming, I could be wrong :thinking:

Are you getting results on your code?

Period {{ctx.periodStart}} - {{ctx.periodEnd}}
Errors Count: {{ctx.results.0.hits.total.value}}
{{#ctx.results.0.hits.hits}}
{{_source.ObjectID}} - {{_source.Module}} - {{_source.MessageID}}
{{_source.ErrorMessage}}
{{/ctx.results.0.hits.hits}}

No, right now my fields are blank too:
{{_source.ObjectID}} - {{_source.Module}} - {{_source.MessageID}}

But I get it working by changing Monitor - period of the check from ‘-1m’ to ‘-2d’ because the data on which Alert is triggered was 2 days ago.

Variables like {{ctx.monitor.name}} are static - they have already defined values this is why they are shown.
Variables like results of the Monitor data are dynamic - they are got as are result of the defined Monitor. If right now, when you do a preview, your Monitor doesn’t return any hits (data about ‘failed VPN login’) your dynamic variable will be blank.

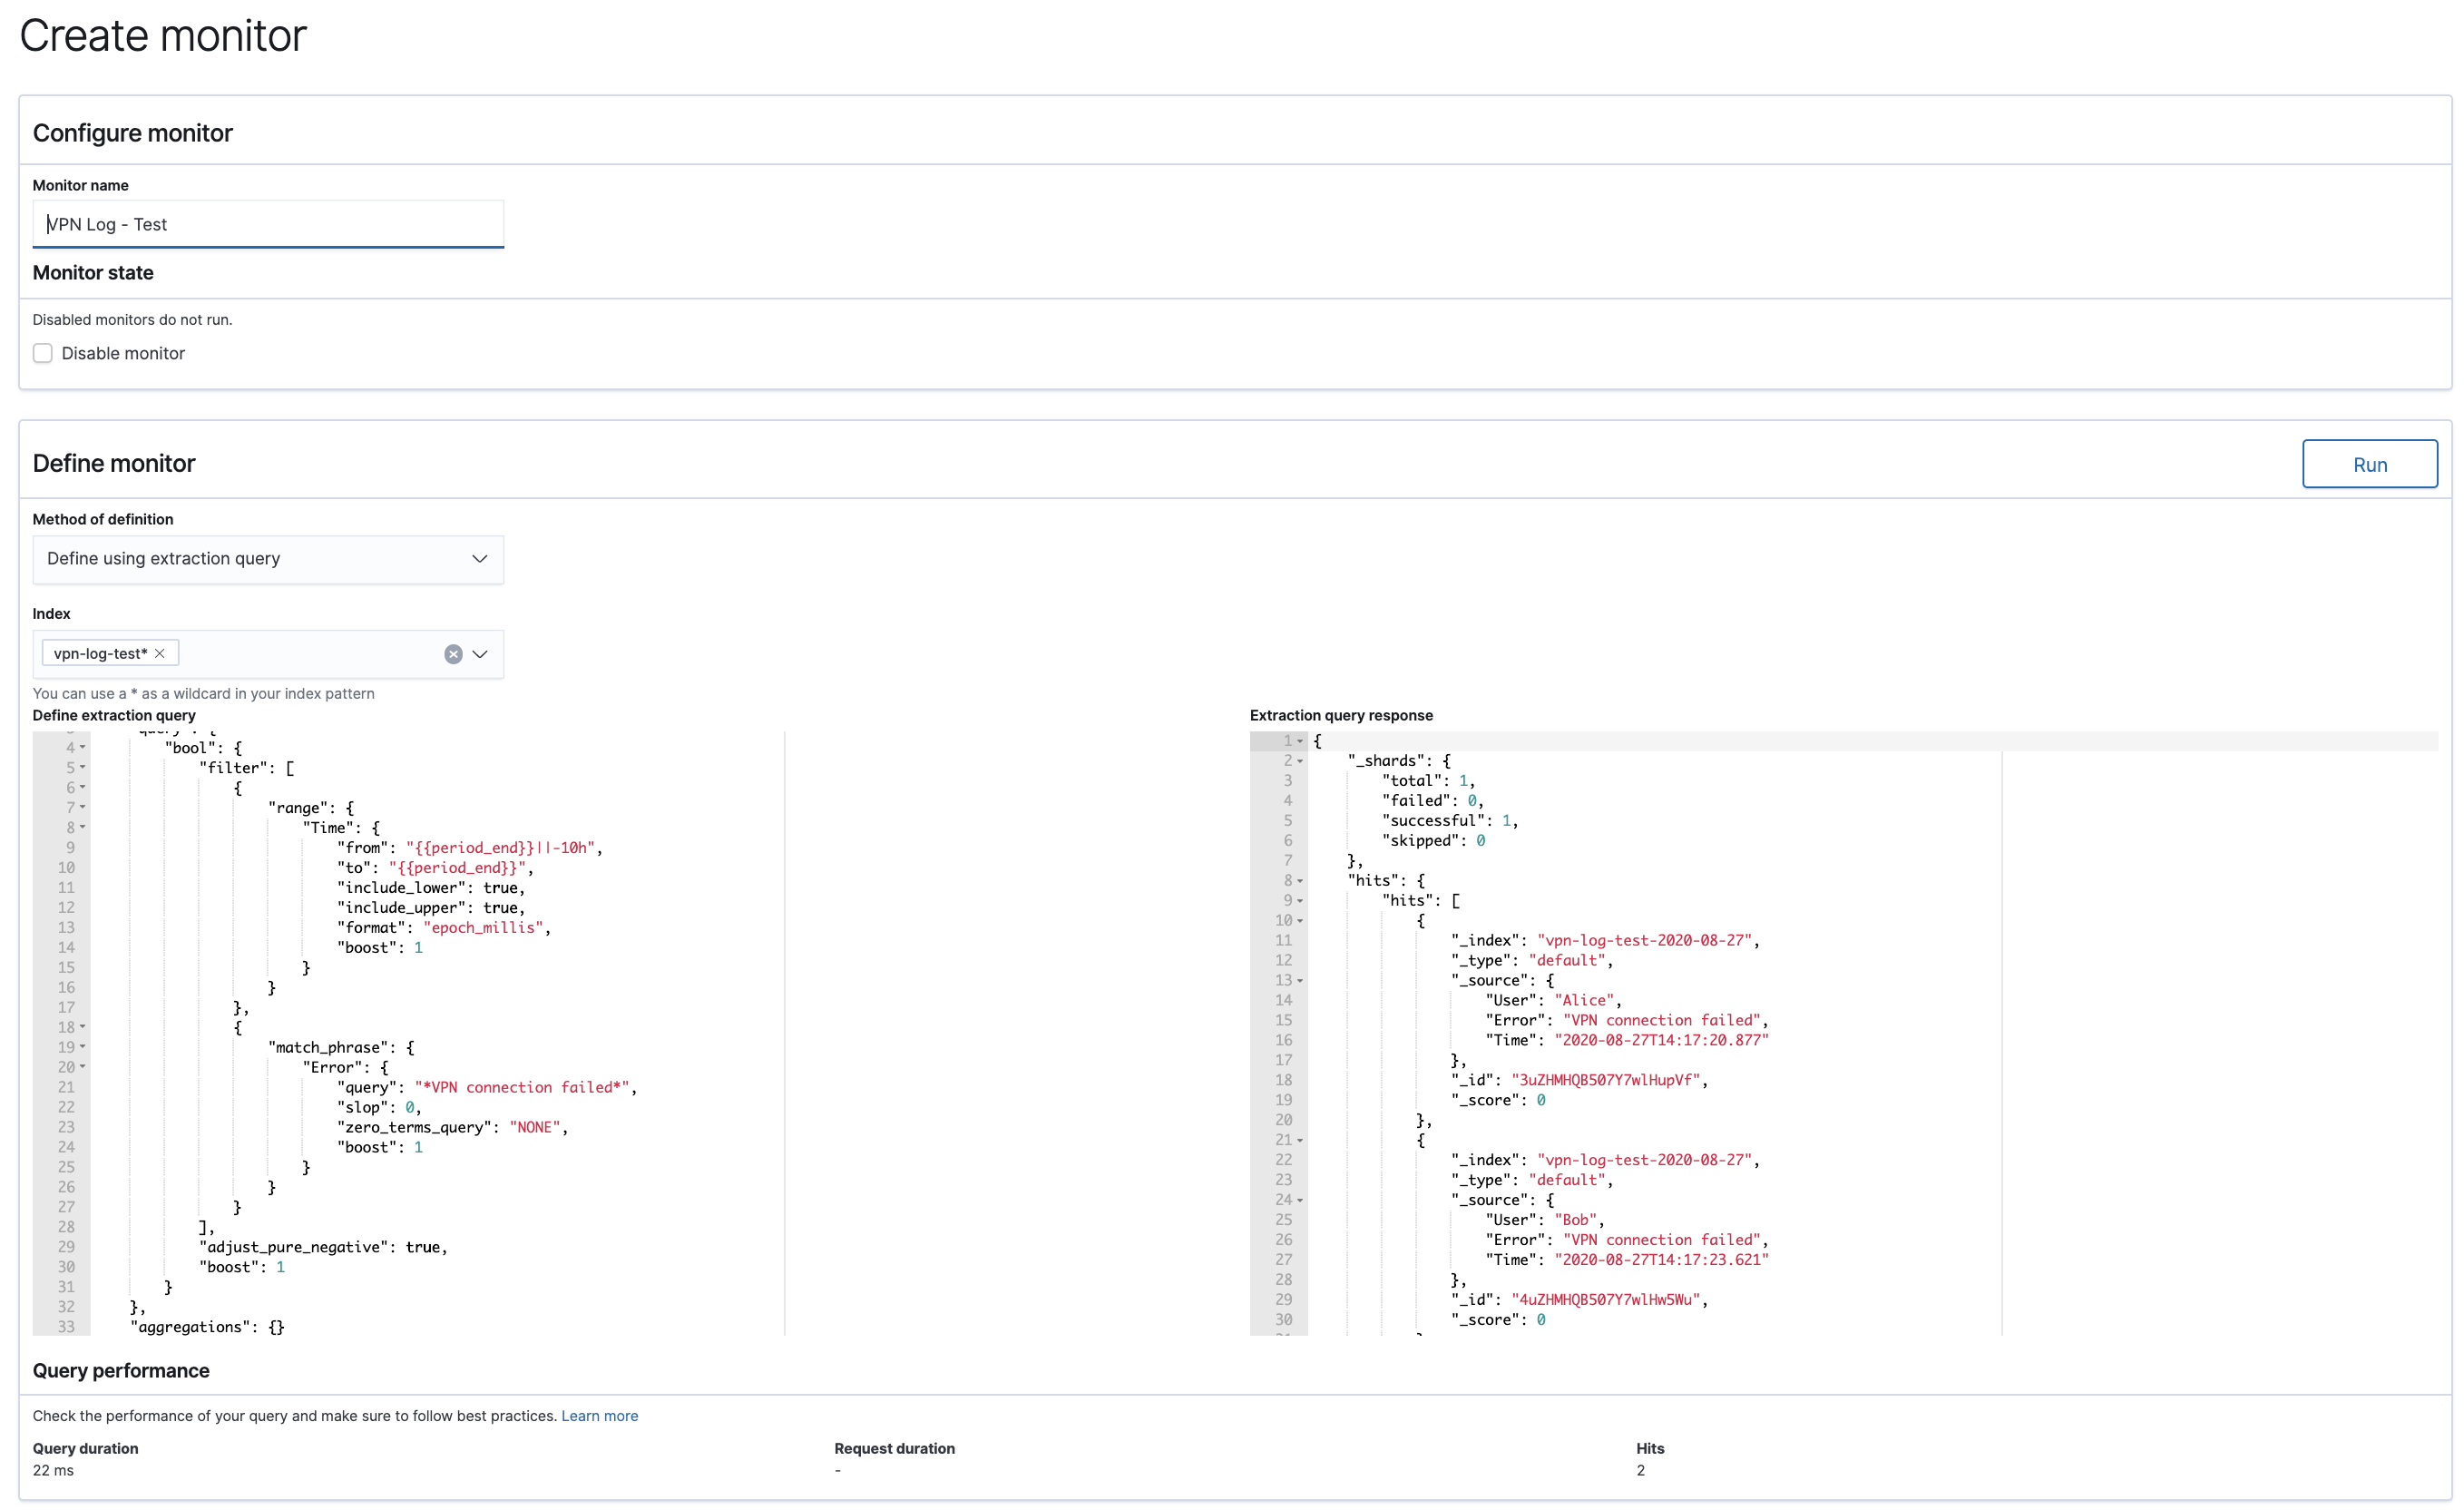
  1. Change your Monitor and make sure when you press ‘Run’ button you see data in the right pane - Extraction query response and press Update (save Monitor with the new conditions which return the hits)
  2. Under the Trigger, in the Trigger condition response pane you should be able to see the data from the Monitor and you also will be able to see dynamic fields in the Preview.

Thank you for your explanation! very enriching.
How do you change the monitor period? I haven’t found a setting for it.

Thanks in advance!

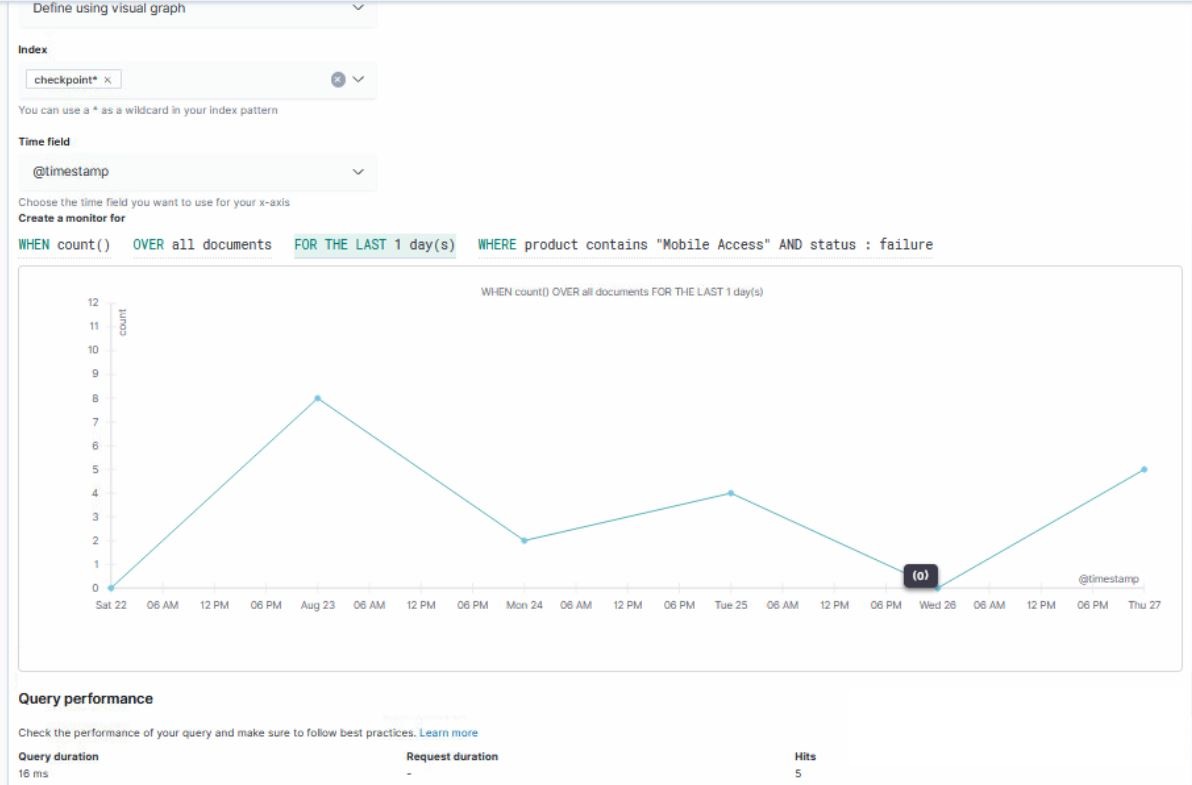
It depends of the your Monitor settings. We use ‘extraction query’ to monitor the data, like on the screen.
It is a query with specific time-range for verification - we check every minute for the range of the one minute.

If you use ‘visual chart’ you probably should be able to change your parameters with the mouse, like on the next screen

Thanks!
Understood.

I am using the “visual chart” option.

But In case I want to trigger an alert in real time of a failed VPN login and display the username who failed to log in, how would I do it?
If the monitor will collect data from the last 1-2 days, the data that will be shown within the email alert will be irrelevant \ inaccurate.

If you want to see at least any data in the Trigger and its preview you should set your Monitor to get at least one result, to be able to create your Mail messages Subject and Body.

When you will finish Trigger configuration, you can return Monitor back to the preferred settings.

Thanks,
I understand but I’m referring to the syntax itself, even if i set the monitor to 2 days and type:

{{#ctx.results.0.hits.hits}}
Username: {{_source.user}}
{{/ctx.results.0.hits.hits}}

I get no results (blank).

What do you see in the Trigger?

In my case it is empty because no any data is returned by the Monitor and returned data doesn’t meet a trigger conditions

If i type:

{{ctx.results.0.hits.total.value}}

On the message pane, i get “73”.

It means that Monitor return some data. And now we should iterate over it:

{{#ctx.results.0.hits.hits}}
All data: {{_source}}
Username: {{_source.user}}
{{/ctx.results.0.hits.hits}}

This is the problem, It doesn’t work :confused:

Message preview is blank.

Please do some tests without iteration:

-- Without iteration:
All Data: {{ctx.results.0.hits.hits.0._source}}
Timestamp: {{ctx.results.0.hits.hits.0._source.@timestamp}}
Scope: {{ctx.results.0.hits.hits.0._source.Scope}}
Message: {{ctx.results.0.hits.hits.0._source.Message}}

No results…

Just to clarify, I do have results on “Discovery” and can make alerts by specific terms (which all work).

Just prepared a short guide how to create an alarm based on the query. You can easy test it or in case of need adapt to your case.

1. Create an index

The index with the prefix vpn-log-test will be created. You can change prefix in the scrips variable

# Variables
elasticsearch_url=http://localhost:9200
date=$(date +%Y-%m-%d)
index_name=vpn-log-test-$date
index_type=default

users="Alice Bob"
error="VPN connection failed"

# Log to the Elasticsearch
for user in $users; do
  time=$(date +%Y-%m-%d'T'%H:%M:%S.%3N)

  curl -H "Content-Type: application/json" \
     -XPOST "$elasticsearch_url/$index_name/$index_type" \
     -d "{\"Time\":\"$time\", \"User\":\"$user\", \"Error\":\"$error\"}"
     sleep 2
done
2. Create an Index Pattern
Kibana --> Management --> Index Patterns --> Create index pattern:

Index pattern: vpn-log-test*
Time Filter field name: time

--> Create index pattern
3. Discover the data

4. Create a Monitor based on the query
{
    "size": 1000,
    "query": {
        "bool": {
            "filter": [
                {
                    "range": {
                        "Time": {
                            "from": "{{period_end}}||-10h",
                            "to": "{{period_end}}",
                            "include_lower": true,
                            "include_upper": true,
                            "format": "epoch_millis",
                            "boost": 1
                        }
                    }
                },
                {
                    "match_phrase": {
                        "Error": {
                            "query": "*VPN connection failed*",
                            "slop": 0,
                            "zero_terms_query": "NONE",
                            "boost": 1
                        }
                    }
                }
            ],
            "adjust_pure_negative": true,
            "boost": 1
        }
    },
    "aggregations": {}
}

5. Create a Trigger for the created Monitor

Message

Monitor {{ctx.monitor.name}} just entered alert status. Please investigate the issue.
- Trigger: {{ctx.trigger.name}}
- Severity: {{ctx.trigger.severity}}
- Period {{ctx.periodStart}} - {{ctx.periodEnd}}
- Count: {{ctx.results.0.hits.total.value}}

{{#ctx.results.0.hits.hits}}
{{_source.Time}} - {{_source.User}} - {{_source.Error}}
{{/ctx.results.0.hits.hits}}

6. Check Alarm

Question related to the alarm based on the chart still need to be investigated.

3 Likes

Found an interesting information in the forum thread:

You could click the info button near the Trigger condition editor area in Define trigger page. It will show you directly with JSON response of what’s available under the “ctx” variable.
I can see such button only in case of the query, not chart.

Wow, Thank you for elaborating.

I think I kind of did all.
I deleted the old VPN index and created a new index pattern, called “checkpoint*”. (our firewall)
The data get indexed successfully on the “discovery” node, as can be seen here (I filtered the results):

I created a monitor, based on the query for failed vpn login (shows hits), as can be seen here:

After that, I created a trigger (which also shows hits):

Created an Alarm \ Action:

Everything seems to be configured correctly.
Alerts are being sent by email without further issues everytime there’s a failed login (usually on the monitor I’m using 1 minutes and not 1 day as the example above).

The basic CTX commands are working without any issues but when I’m trying to use one of your suggestions above (with or without iteration) nothing seems to be displayed.

I’m not an experienced programmer, am i missing something during the process?

Thanks again!
Your help is much appreciated.