Just prepared a short guide how to create an alarm based on the query. You can easy test it or in case of need adapt to your case.
1. Create an index
The index with the prefix vpn-log-test will be created. You can change prefix in the scrips variable
# Variables
elasticsearch_url=http://localhost:9200
date=$(date +%Y-%m-%d)
index_name=vpn-log-test-$date
index_type=default

users="Alice Bob"
error="VPN connection failed"

# Log to the Elasticsearch
for user in $users; do
  time=$(date +%Y-%m-%d'T'%H:%M:%S.%3N)

  curl -H "Content-Type: application/json" \
     -XPOST "$elasticsearch_url/$index_name/$index_type" \
     -d "{\"Time\":\"$time\", \"User\":\"$user\", \"Error\":\"$error\"}"
     sleep 2
done
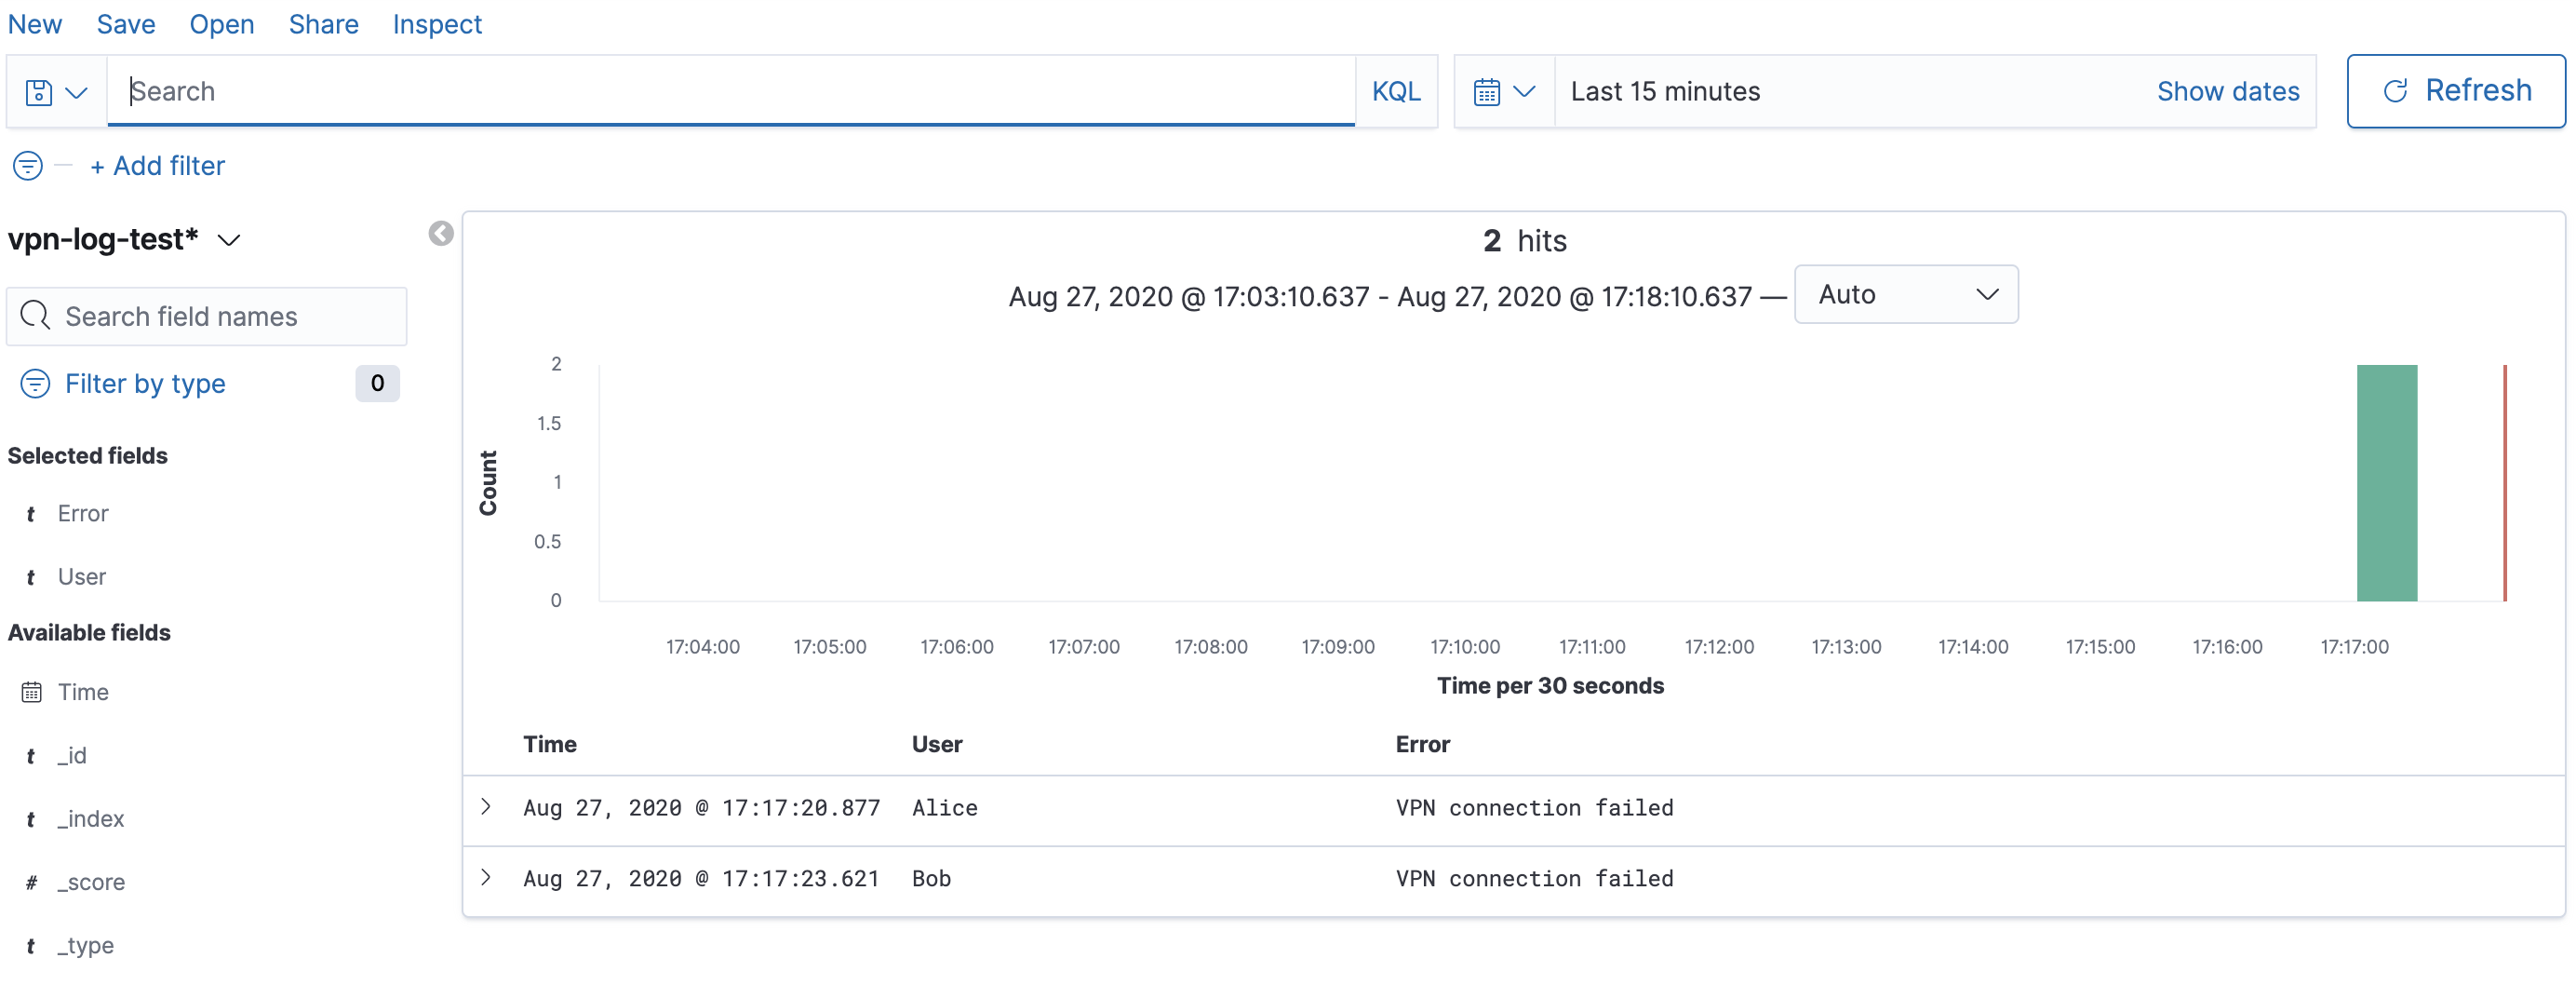
2. Create an Index Pattern
Kibana --> Management --> Index Patterns --> Create index pattern:

Index pattern: vpn-log-test*
Time Filter field name: time

--> Create index pattern
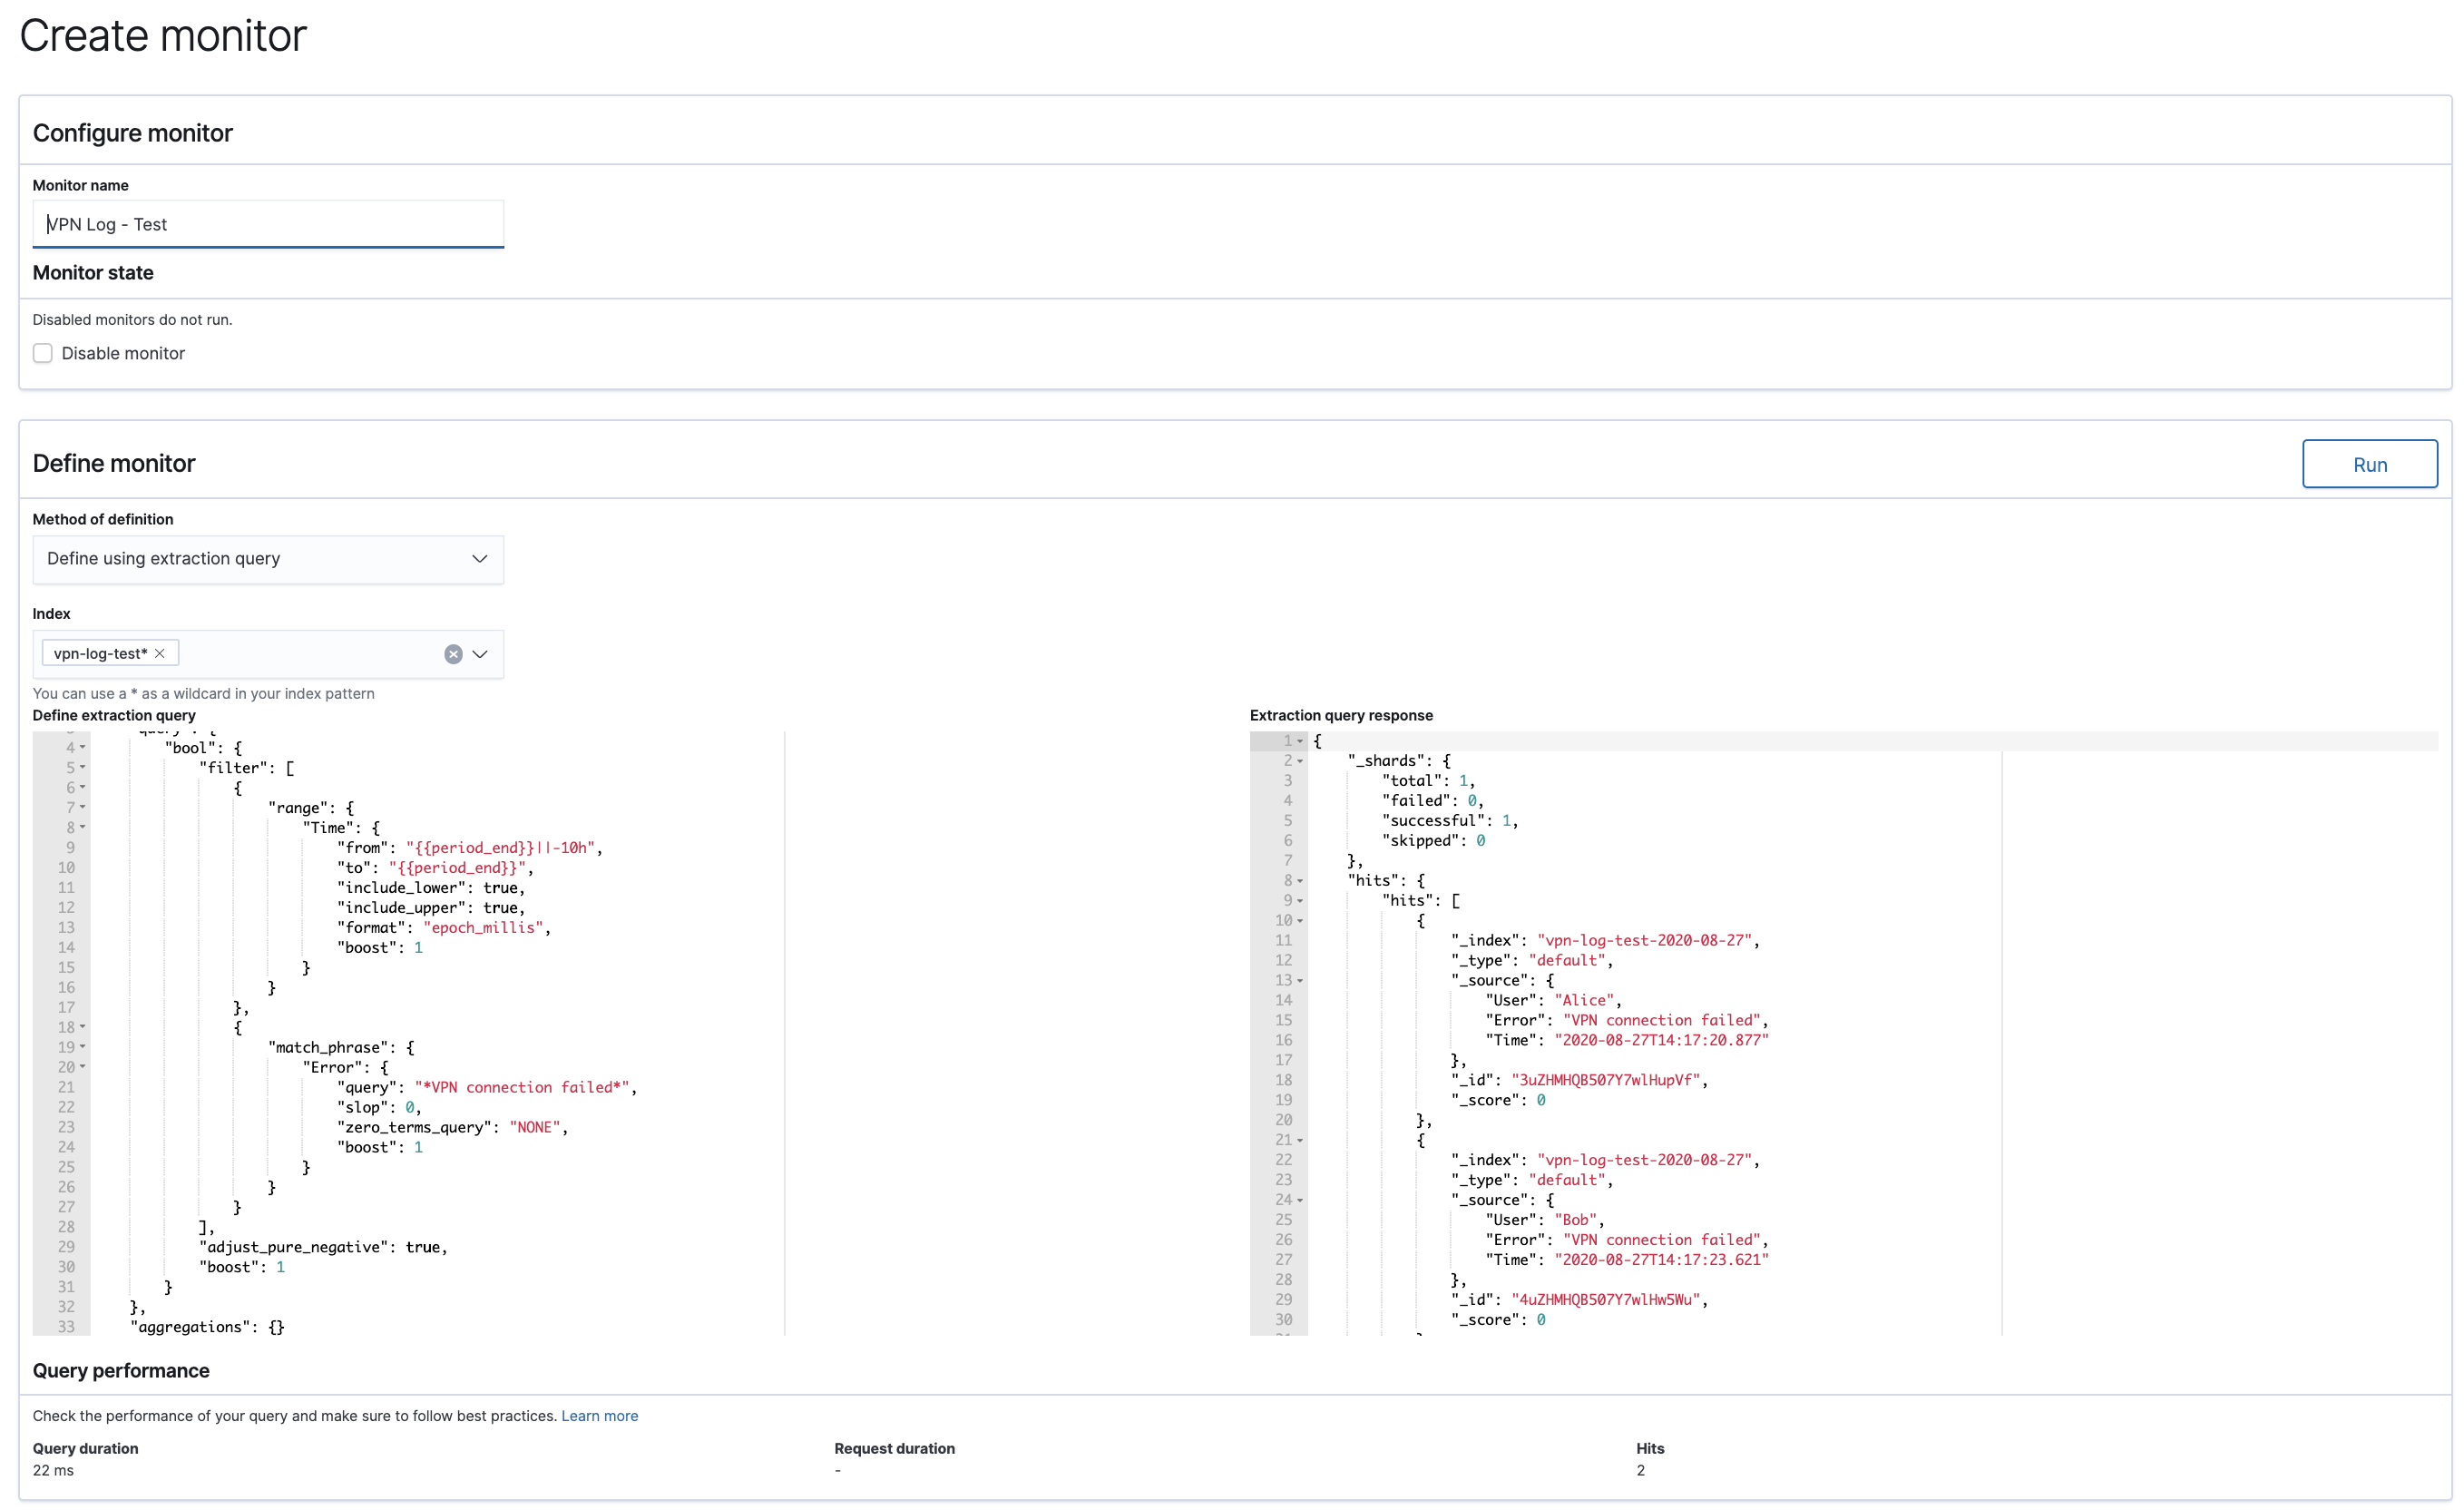
4. Create a Monitor based on the query
{
    "size": 1000,
    "query": {
        "bool": {
            "filter": [
                {
                    "range": {
                        "Time": {
                            "from": "{{period_end}}||-10h",
                            "to": "{{period_end}}",
                            "include_lower": true,
                            "include_upper": true,
                            "format": "epoch_millis",
                            "boost": 1
                        }
                    }
                },
                {
                    "match_phrase": {
                        "Error": {
                            "query": "*VPN connection failed*",
                            "slop": 0,
                            "zero_terms_query": "NONE",
                            "boost": 1
                        }
                    }
                }
            ],
            "adjust_pure_negative": true,
            "boost": 1
        }
    },
    "aggregations": {}
}
5. Create a Trigger for the created Monitor
Message
Monitor {{ctx.monitor.name}} just entered alert status. Please investigate the issue.
- Trigger: {{ctx.trigger.name}}
- Severity: {{ctx.trigger.severity}}
- Period {{ctx.periodStart}} - {{ctx.periodEnd}}
- Count: {{ctx.results.0.hits.total.value}}

{{#ctx.results.0.hits.hits}}
{{_source.Time}} - {{_source.User}} - {{_source.Error}}
{{/ctx.results.0.hits.hits}}


Question related to the alarm based on the chart still need to be investigated.