We got a stack running in containers for some time but a new bug appear after an host reboot today.
We have 12 elastic Node on 3 Host in containers :
Each servers has 2 Data node, 1 Ingest and 1 Master eligible.
We rebooted an host today to do some test (not elastic related) and when we closed it, our other master node crash with a memory issue…
When we started it back up, nothing can be done, as soon as one elastic master node is elected as master, we see in a few second this message appear :
[2021-04-06T21:16:57,258][WARN ][o.e.i.b.in_flight_requests] [ODE-MASTER-002] [in_flight_requests] New used memory 32764433992 [30.5gb] for data of [<http_request>] would be larger than configured breaker: 17179869184 [16gb], breaking
In less than 30 sec it pass from 0 to twice the heap value.
If we stop the ingest node, everythings run smoothly. As soon as we start one, the memory issue occur and less than a minute after the master node goes OOM again.
What can an ingest node do to fill the master node heap this quickly?
How can I debug this?
We are currently running 1.13.1 and it’s been running fine for the last 2 weeks.
I did more debug and the bug is directly related to the number of winlogbeat client sending logs.
I can’t but half the client I had on the stack before it goes OOM.
Since our ingest node and master node aren’t on the same containter, could it be related to some throttle that isn’t taking place to prevent the ingest node to send too much data to the master node?
It seems a client application can close the connection socket.
It could be caused by a misconfiguration an HTTP client library or networking issues that stall the connections.
Can you check your aggregations (i.e datetime on interval of 1 seconds on an year)?
You usually see so large contexts because you are executing queries that aggregates too much data 1.3GB for request and your client should be stuck in the request.
You can also try to see in hot threads (Nodes hot threads API | Elasticsearch Guide [8.4] | Elastic ) or in slow queries log if you are able to understand which queries are stuck.
A client level your requests should be stuck and probably riexecuted.
It’s quite strange because the ES circuit breaker are not fired.
We currently have 6 Data node, 3 master node and 3 ingest node.
The bug appear as soon as one master node is elected, it wont even wait for the data node to come online.
We dont execute query, we dont even start Kibana dockers.
Once a master node is elected, the ingest node start sending transport communication to the master node and it’s overwhelm in less than 30 sec. In fact I’ve seen it pass from 16GB to 30 GB heap request in less than 6 seconds.
If a query is done a this point its inside winlogbeat/filebeat/ingest node communication process.
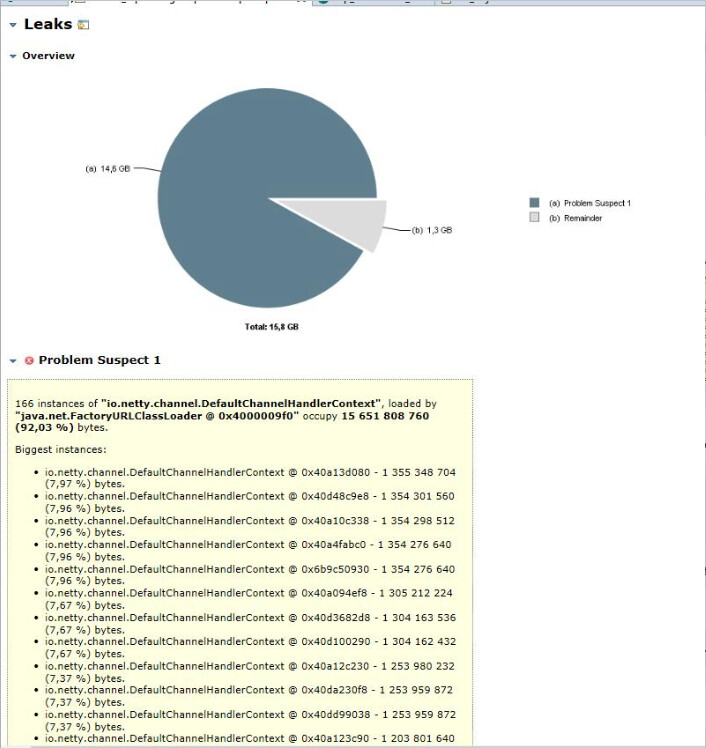
If we browse the heap dump, the vast majority of the heap is queueWrites elements…
If I browse the bytes It’s a lot of 50MB chunk containing various information, i’m not able to pinpoint from where it’s happening. Is it the ingest node that doesn’t throttle when the master is overloaded?
If I limit the input client to just a few, I see a lot of mapping modification, but I dont see them when letting all the client contact the ingest node.
You should not send data to a cluster when it’s not ready.
Probably you are sending to much data on masters and if the data nodes are not up and running, you are overloading them.
Start the cluster in this order:
data nodes, master nodes
ingest nodes when it’s green
Try also to reduce the size of your bulks from logstash.
How many instances of logstash do you have?
Check also if it’s required to increase the actual on flight pools to more large number (default 1000 entries).
In fact we tried with the cluster all green and if it’s not and we got exactly the same dissue. I just wanted to point out it has the same beavior even if the data node aren’t up.
For Logstash, we dont use it at this point. We dont do any manipulation on the date, we just point the winlogbeat directly to our ingest node.
For the flight pool, I’ll check if a different value modify the behavior.
I finally found a way to prevent the issue, but I’m not sure it’s the best way, any input on how to fix this the best way would be great.
I find out that it was a lot of transport communication comming from the data node that was creating the bug. They would send a lot of bulk transport packadge of 50MB (that seem to be the default max size) to the master when they were receiving new data. It seem that the way the heap space is calculated is an approximation (for the addition CircuitBreakingException on extremely small dataset · Issue #18144 · elastic/elasticsearch · GitHub).
If I understand correctly, since we got a lot of max size bulk, it doesn’t approximate the memory use accurately, and then the OOM happen. If we increase the network.breaker.inflight_requests.overhead to 3 (2 is the default) It will calculate a greater space used and work like it should.
The problem is I find this tweak a rule of thumb and I would really want to know how this can be setup to prevent future issues.