Hello,
Currently my Action Message is the default one.
Message: {{ctx.monitor.name}}
Trigger: {{ctx.trigger.name}}
Severity: {{ctx.trigger.severity}}
Alert time: {{ctx.periodStart}}
I tried to access fields by doing something like that but without success:
Monitor {{ctx.monitor.name}} just entered alert status. Please investigate the issue.> Alert time {{ctx.periodStart}}
Errors Count: {{ctx.results.0.hits.total.value}}#ctx .results.0.hits.hits}}
How can i do that?
I figured it out, thanks.
kris
January 5, 2022, 5:58pm
3
Glad to hear you figured it out @AndreyB - if you have the time to post your solution, I’m sure the rest of the community would find it useful
1 Like
So here is the solution:
Discover the data you want to add alert to it in index.
Save the query.
Create a monitor based on query and change the default format to epoch_millis.
{
    "size": 500,
    "query": {
        "bool": {
            "filter": [
                {
                    "match_all": {
                        "boost": 1
                    }
                },
                {
                    "exists": {
                        "field": "m.alert.severity",
                        "boost": 1
                    }
                },
                {
                    "exists": {
                        "field": "m.alert.name",
                        "boost": 1
                    }
                },
                {
                    "range": {
                        "@timestamp": {
                            "from": "{{period_end}}||-2m",
                            "to": "{{period_end}}",
                            "include_lower": true,
                            "include_upper": true,
                            "format": "epoch_millis",
                            "boost": 1
                        }
                    }
                }
            ],
            "adjust_pure_negative": true,
            "boost": 1
        }
    },
    "version": true,
    "_source": {
        "includes": [],
        "excludes": []
    },
    "stored_fields": "*",
    "docvalue_fields": [
        {
            "field": "@timestamp",
            "format": "date_time"
        },
        {
            "field": "created",
            "format": "date_time"
        },
        {
            "field": "m.params.cartProducts.createdTime",
            "format": "date_time"
        },
        {
            "field": "m.time",
            "format": "date_time"
        }
    ],
    "script_fields": {},
    "sort": [
        {
            "@timestamp": {
                "order": "desc",
                "unmapped_type": "boolean"
            }
        }
    ],
    "aggregations": {
        "2": {
            "date_histogram": {
                "field": "@timestamp",
                "time_zone": "Asia/Jerusalem",
                "fixed_interval": "1s",
                "offset": 0,
                "order": {
                    "_key": "asc"
                },
                "keyed": false,
                "min_doc_count": 1
            }
        }
    },
    "highlight": {
        "pre_tags": [
            "@opensearch-dashboards-highlighted-field@"
        ],
        "post_tags": [
            "@/opensearch-dashboards-highlighted-field@"
        ],
        "fragment_size": 2147483647,
        "fields": {
            "*": {}
        }
    }
}
4 Likes
kris
January 6, 2022, 6:46pm
5
Thank you @AndreyB - appreciate the write up!
1 Like
zubrik
January 13, 2022, 3:59pm
6
Hi @AndreyB ,
thanks a lot.
Hi @zubrik ,
1 Like
IvanC
February 21, 2022, 6:51pm
8
I do what you indicated, but for some reason, when sending an email, all the required fields are empty, could you please tell me or show a complete picture of your monitor: trigger, query and action
AndreyB
February 22, 2022, 6:56am
9
Hi @IvanC ,
IvanC
February 22, 2022, 12:15pm
10
The fact is that I send the actual problem, I understand that there are no fields in the test message, but the problem persists (
Therefore, it seems to me that I indicated something incorrectly in the query or trigger itself.
AndreyB
February 22, 2022, 2:16pm
11
Have you added the needed fields to stored_fields in a query editor?
"docvalue_fields": [
        {
            "field": "@timestamp",
            "format": "date_time"
        },
                {
            "field": "container.name",
            "format": "string"
        },
        {
            "field": "host",
            "format": "string"
        },
        {
            "field": "m.alert.severity",
            "format": "string"
        },
        {
            "field": "m.alert.name",
            "format": "string"
        },
        {
            "field": "m.stackTrace",
            "format": "string"
        }
And then you should define those field in the Action:
 Monitor {{ctx.monitor.name}} just entered ALERT status. Please investigate the issue.
- Alert time: {{ctx.periodStart}}

{{#ctx.results.0.hits.hits}}
> {{_source.container.name}} - {{_source.host}} - {{_source.m.alert.severity}}
> {{_source.m.alert.name}}
> {{_source.m.stackTrace}}
{{/ctx.results.0.hits.hits}}
sateesh
February 23, 2022, 4:28am
12
@AndreyB where can i add those docvalue after aggregations or before
so i have this query and query response like this
so now i want to get that query in email alert how can i do that help me to figure it out thanks.
AndreyB
February 23, 2022, 7:24am
13
In my code it comes after the aggregation.
{
    "size": 500,
    "query": {
        "bool": {
            "filter": [
                {
                    "match_all": {
                        "boost": 1
                    }
                },
                {
                    "exists": {
                        "field": "m.alert.severity",
                        "boost": 1
                    }
                },
                {
                    "exists": {
                        "field": "m.alert.name",
                        "boost": 1
                    }
                },
                {
                    "range": {
                        "@timestamp": {
                            "from": "{{period_end}}||-2m",
                            "to": "{{period_end}}",
                            "include_lower": true,
                            "include_upper": true,
                            "format": "epoch_millis",
                            "boost": 1
                        }
                    }
                }
            ],
            "adjust_pure_negative": true,
            "boost": 1
        }
    },
    "version": true,
    "_source": {
        "includes": [],
        "excludes": []
    },
    "stored_fields": "*",
    "docvalue_fields": [
        {
            "field": "@timestamp",
            "format": "date_time"
        },
        {
            "field": "created",
            "format": "date_time"
        },
        {
            "field": "m.params.cartProducts.createdTime",
            "format": "date_time"
        },
        {
            "field": "m.time",
            "format": "date_time"
        }
    ],
    "script_fields": {},
    "sort": [
        {
            "@timestamp": {
                "order": "desc",
                "unmapped_type": "boolean"
            }
        }
    ],
    "aggregations": {
        "2": {
            "date_histogram": {
                "field": "@timestamp",
                "time_zone": "Asia/Jerusalem",
                "fixed_interval": "1s",
                "offset": 0,
                "order": {
                    "_key": "asc"
                },
                "keyed": false,
                "min_doc_count": 1
            }
        }
    },
    "highlight": {
        "pre_tags": [
            "@opensearch-dashboards-highlighted-field@"
        ],
        "post_tags": [
            "@/opensearch-dashboards-highlighted-field@"
        ],
        "fragment_size": 2147483647,
        "fields": {
            "*": {}
        }
    }
}
sateesh
February 23, 2022, 7:28am
14
what are the m.alert.severity and m.alert.name those are the feilds existed in your index or what could u plz expain in detail
AndreyB
February 23, 2022, 7:59am
15
@sateesh m.alert its just a field that i’m creating using my logstash parsing.
sateesh
February 23, 2022, 8:12am
16
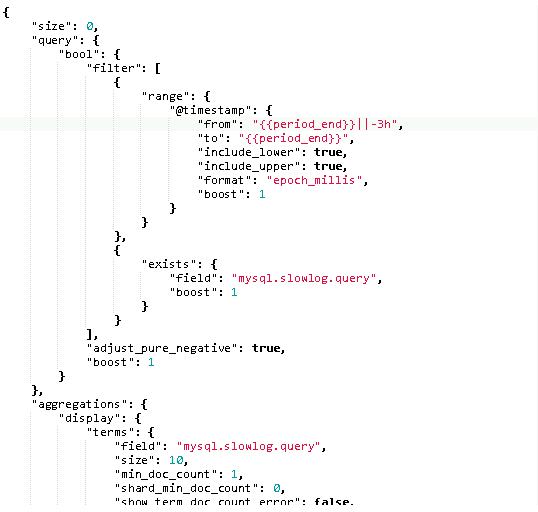
okay but here in my case we are not using logstash directly we are pushing metrics to es using metricbeat. same like your script i just wrote@timestamp ”: {@timestamp ”,
],
"aggregations": {
     "display": {
        "terms": {
            "field": "mysql.slowlog.query",
            "size": 10,
            "min_doc_count": 1,
            "shard_min_doc_count": 0,
            "show_term_doc_count_error": false,
            "order": [
                {
                    "_count": "desc"
                },
                {
                    "_key": "asc"
                }
            ]
        }
    }
}

    }
but i am unable to get those feilds, do i mis anything here in script i am gettinf the results but unable get those action
AndreyB
February 23, 2022, 8:40am
17
@sateesh Where did you get this script from?
Filter the data i want to add alert to it in index in Discover tab.
Press on “Inspect” on the upper right corner and press “Request”.
Copy the script. This is the script i create monitor based on it and this script already have “docvalue_fields”.
2 Likes
sateesh
February 24, 2022, 5:37am
18
I tried the same way the response is different when i copy that script to monitor i don’t know why ,which version r u using ?? i am using elasticsearch 7.10.2
AndreyB
February 24, 2022, 6:52am
19
@sateesh i’m using OpenSearch 1.2.4.
Gsmitt
May 23, 2023, 2:05am
20
hey @AndreyB
Thanks for the demo, worked great plus the little trick of copy & paste from the discovery awesome
2 Likes