Error failed parsing SAML config

Hello,

I’m new at OpenDistro ES.
Trying to configure OpenDistro Elasticsearch SAML using these instructions.

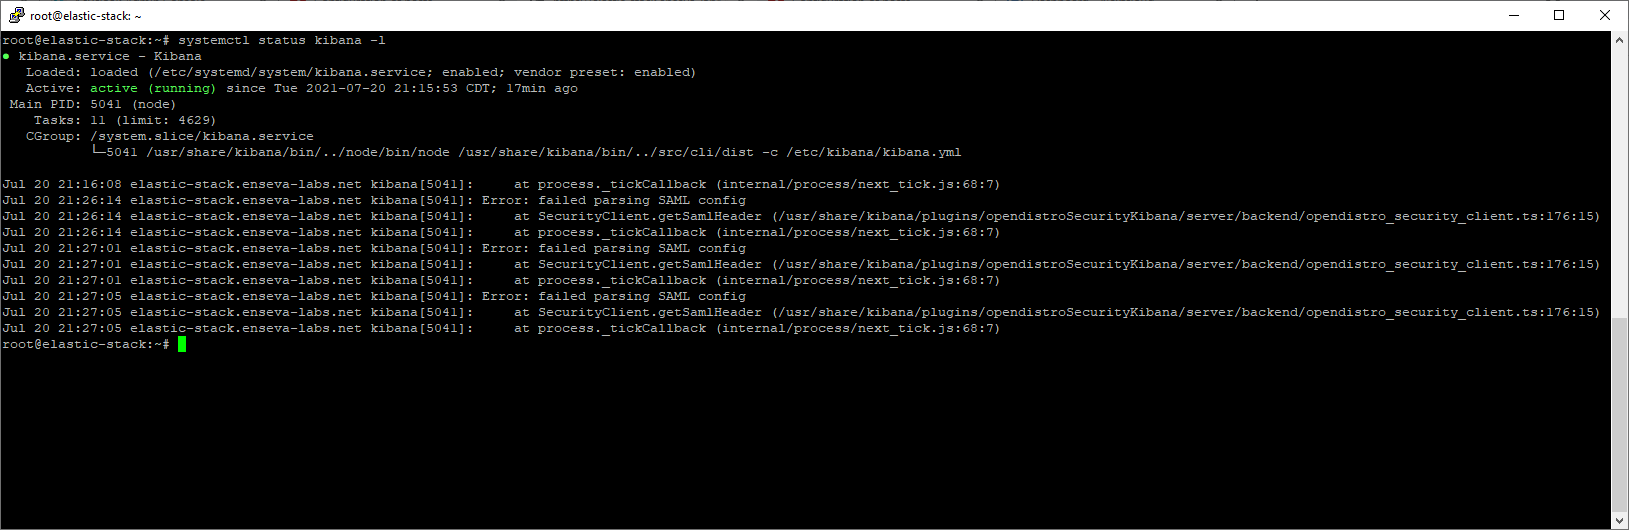
My error in Kibana after the configuration were made is shown below. These were found by executing this command “journalctl -u kibana.service”.

Kibana.Service_logs

Jul 14 21:25:59 elastic-stack kibana[50516]:     at SecurityClient.getSamlHeader (/usr/share/kibana/plugins/opendistroSecurityKibana/server/backend/opendistro_security_client.ts:176:15)
Jul 14 21:25:59 elastic-stack kibana[50516]:     at process._tickCallback (internal/process/next_tick.js:68:7)
Jul 14 21:25:59 elastic-stack kibana[50516]: Error: failed parsing SAML config
Jul 14 21:25:59 elastic-stack kibana[50516]:     at SecurityClient.getSamlHeader (/usr/share/kibana/plugins/opendistroSecurityKibana/server/backend/opendistro_security_client.ts:176:15)
Jul 14 21:25:59 elastic-stack kibana[50516]:     at process._tickCallback (internal/process/next_tick.js:68:7)
Jul 14 21:26:00 elastic-stack kibana[50516]: Error: failed parsing SAML config
Jul 14 21:26:00 elastic-stack kibana[50516]:     at SecurityClient.getSamlHeader (/usr/share/kibana/plugins/opendistroSecurityKibana/server/backend/opendistro_security_client.ts:176:15)
Jul 14 21:26:00 elastic-stack kibana[50516]:     at process._tickCallback (internal/process/next_tick.js:68:7)
Jul 14 21:44:06 elastic-stack kibana[50516]: Error: failed parsing SAML config
Jul 14 21:44:06 elastic-stack kibana[50516]:     at SecurityClient.getSamlHeader (/usr/share/kibana/plugins/opendistroSecurityKibana/server/backend/opendistro_security_client.ts:176:15)
Jul 14 21:44:06 elastic-stack kibana[50516]:     at process._tickCallback (internal/process/next_tick.js:68:7)
Jul 14 21:44:07 elastic-stack kibana[50516]: Error: failed parsing SAML config
Jul 14 21:44:07 elastic-stack kibana[50516]:     at SecurityClient.getSamlHeader (/usr/share/kibana/plugins/opendistroSecurityKibana/server/backend/opendistro_security_client.ts:176:15)
Jul 14 21:44:07 elastic-stack kibana[50516]:     at process._tickCallback (internal/process/next_tick.js:68:7)
Jul 14 21:44:08 elastic-stack kibana[50516]: Error: failed parsing SAML config
Jul 14 21:44:08 elastic-stack kibana[50516]:     at SecurityClient.getSamlHeader (/usr/share/kibana/plugins/opendistroSecurityKibana/server/backend/opendistro_security_client.ts:176:15)
Jul 14 21:44:08 elastic-stack kibana[50516]:     at process._tickCallback (internal/process/next_tick.js:68:7)
Jul 14 21:44:09 elastic-stack kibana[50516]: Error: failed parsing SAML config
Jul 14 21:44:09 elastic-stack kibana[50516]:     at SecurityClient.getSamlHeader (/usr/share/kibana/plugins/opendistroSecurityKibana/server/backend/opendistro_security_client.ts:176:15)
Jul 14 21:44:09 elastic-stack kibana[50516]:     at process._tickCallback (internal/process/next_tick.js:68:7)

I looked through these posts below , but some were never answered, or it wasn’t related to my environment issue.

https://forum.opensearch.org/search?q=SAML

My Environment:
Using Open Distro for Elasticsearch 1.13.2

Elasticsearch.yml
root@elastic-stack:/etc/elasticsearch# grep -v "^#\|^$" elasticsearch.yml
path.data: /var/lib/elasticsearch
path.logs: /var/log/elasticsearch
network.host: 10.200.6.21
http.port: 9200
discovery.type: single-node
action.auto_create_index: true
opendistro_security.ssl.transport.pemcert_filepath: /etc/elasticsearch/admin.pem
opendistro_security.ssl.transport.pemkey_filepath: /etc/elasticsearch/admin-key.pem
opendistro_security.ssl.transport.pemtrustedcas_filepath: /etc/elasticsearch/root-ca.pem
opendistro_security.ssl.transport.enforce_hostname_verification: false
opendistro_security.ssl.http.enabled: true
opendistro_security.ssl.http.pemcert_filepath: /etc/elasticsearch/admin.pem
opendistro_security.ssl.http.pemkey_filepath: /etc/elasticsearch/admin-key.pem
opendistro_security.ssl.http.pemtrustedcas_filepath: /etc/elasticsearch/root-ca.pem
opendistro_security.allow_unsafe_democertificates: false
opendistro_security.allow_default_init_securityindex: true
opendistro_security.authcz.admin_dn:
  - 'CN=elastic-stack.enseva-labs.net,OU=admin,O=enseva,L=cedar rapids,ST=iowa,C=us'
opendistro_security.audit.type: internal_elasticsearch
opendistro_security.enable_snapshot_restore_privilege: true
opendistro_security.check_snapshot_restore_write_privileges: true
opendistro_security.restapi.roles_enabled: ["all_access", "security_rest_api_access"]
opendistro_security.system_indices.enabled: true
opendistro_security.system_indices.indices: [".opendistro-alerting-config", ".opendistro-alerting-alert*", ".opendistro-anomaly-results*", ".opendistro-anomaly-detector*", ".opendistro-anomaly-checkpoints", ".opendistro-anomaly-detection-state", ".opendistro-reports-*", ".opendistro-notifications-*", ".opendistro-notebooks", ".opendistro-asynchronous-search-response*"]
cluster.routing.allocation.disk.threshold_enabled: false
node.max_local_storage_nodes: 3
Kibana.yml
root@elastic-stack:/etc/kibana# grep -v "^#\|^$" kibana.yml
server.host: "10.200.6.21"
server.port: 5601
server.name: "elastic-stack.enseva-labs.net"
server.ssl.enabled: true
server.ssl.key: "/etc/kibana/admin-key.pem"
server.ssl.certificate: "/etc/kibana/admin.pem"
elasticsearch.hosts: "https://elastic-stack.enseva-labs.net:9200"
elasticsearch.username: admin
elasticsearch.password: admin
elasticsearch.requestHeadersWhitelist: ["securitytenant","Authorization"]
elasticsearch.ssl.certificateAuthorities: "/etc/kibana/root-ca.pem"
elasticsearch.ssl.verificationMode: none
opendistro_security.multitenancy.enabled: true
opendistro_security.multitenancy.tenants.preferred: ["Private", "Global"]
opendistro_security.readonly_mode.roles: ["kibana_read_only"]
opendistro_security.auth.type: "saml"
server.xsrf.whitelist: ["/_opendistro/_security/saml/acs", "/_opendistro/_security/saml/logout"]
opendistro_security.cookie.secure: false
newsfeed.enabled: false
telemetry.optIn: false
telemetry.enabled: false
security.showInsecureClusterWarning: false
map.includeElasticMapsService: false
logging.dest: '/etc/kibana/kibana.log'
opendistro_security/securityconfig/config.yml
---
_meta:
  type: "config"
  config_version: 2
config:
  dynamic:
    # Set filtered_alias_mode to 'disallow' to forbid more than 2 filtered aliases per index
    # Set filtered_alias_mode to 'warn' to allow more than 2 filtered aliases per index but warns about it (default)
    # Set filtered_alias_mode to 'nowarn' to allow more than 2 filtered aliases per index silently
    #filtered_alias_mode: warn
    #do_not_fail_on_forbidden: false
    #kibana:
    # Kibana multitenancy
    #multitenancy_enabled: true
    #server_username: kibanaserver
    #index: '.kibana'
    http:
      anonymous_auth_enabled: false
      xff:
        enabled: false
        internalProxies: '192\.168\.0\.10|192\.168\.0\.11' # regex pattern
        #internalProxies: '.*' # trust all internal proxies, regex pattern
        #remoteIpHeader:  'x-forwarded-for'
        ###### see https://docs.oracle.com/javase/7/docs/api/java/util/regex/Pattern.html for regex help
        ###### more information about XFF https://en.wikipedia.org/wiki/X-Forwarded-For
        ###### and here https://tools.ietf.org/html/rfc7239
        ###### and https://tomcat.apache.org/tomcat-8.0-doc/config/valve.html#Remote_IP_Valve
    authc:
      kerberos_auth_domain:
        http_enabled: false
        transport_enabled: false
        order: 6
        http_authenticator:
          type: kerberos
          challenge: true
          config:
            # If true a lot of kerberos/security related debugging output will be logged to standard out
            krb_debug: false
            # If true then the realm will be stripped from the user name
            strip_realm_from_principal: true
        authentication_backend:
          type: noop
      basic_internal_auth_domain:
        description: "Authenticate via HTTP Basic against internal users database"
        http_enabled: true
        transport_enabled: true
        order: 0
        http_authenticator:
          type: basic
          challenge: true
        authentication_backend:
          type: intern
      proxy_auth_domain:
        description: "Authenticate via proxy"
        http_enabled: false
        transport_enabled: false
        order: 3
        http_authenticator:
          type: proxy
          challenge: false
          config:
            user_header: "x-proxy-user"
            roles_header: "x-proxy-roles"
        authentication_backend:
          type: noop
      jwt_auth_domain:
        description: "Authenticate via Json Web Token"
        http_enabled: false
        transport_enabled: false
        order: 0
        http_authenticator:
          type: jwt
          challenge: false
          config:
            signing_key: "base64 encoded HMAC key or public RSA/ECDSA pem key"
            jwt_header: "Authorization"
            jwt_url_parameter: null
            roles_key: null
            subject_key: null
        authentication_backend:
          type: noop
      clientcert_auth_domain:
        description: "Authenticate via SSL client certificates"
        http_enabled: false
        transport_enabled: false
        order: 2
        http_authenticator:
          type: clientcert
          config:
            username_attribute: cn #optional, if omitted DN becomes username
          challenge: false
        authentication_backend:
          type: noop
      ldap:
        description: "Authenticate via LDAP or Active Directory"
        http_enabled: false
        transport_enabled: false
        order: 5
        http_authenticator:
          type: basic
          challenge: false
        authentication_backend:
          # LDAP authentication backend (authenticate users against a LDAP or Active Directory)
          type: ldap
          config:
            # enable ldaps
            enable_ssl: false
            # enable start tls, enable_ssl should be false
            enable_start_tls: false
            # send client certificate
            enable_ssl_client_auth: false
            # verify ldap hostname
            verify_hostnames: true
            hosts:
            - localhost:8389
            bind_dn: null
            password: null
            userbase: 'ou=people,dc=example,dc=com'
            # Filter to search for users (currently in the whole subtree beneath userbase)
            # {0} is substituted with the username
            usersearch: '(sAMAccountName={0})'
            # Use this attribute from the user as username (if not set then DN is used)
            username_attribute: null
      saml_auth_domain:
        order: 1
        description: "SAML provider"
        http_enabled: true
        transport_enabled: false
        http_authenticator:
          type: saml
          challenge: true
          config:
            idp:
              metadata_file: /usr/share/elasticsearch/plugins/opendistro_security/securityconfig/keycloak.xml
              entity_id: http://keycloak.enseva-labs.net:8080/auth/realms/elastic/
            sp:
              entity_id: elastic
              forceAuthn: true
            kibana_url: https://elastic-stack.enseva-labs.net:5601/
            roles_key: Role
            exchange_key: 76caaaac-77d8-450a-803d-87364e8a5203
        authentication_backend:
          type: noop
    authz:
      roles_from_myldap:
        description: "Authorize via LDAP or Active Directory"
        http_enabled: false
        transport_enabled: false
        authorization_backend:
          # LDAP authorization backend (gather roles from a LDAP or Active Directory, you have to configure the above LDAP authentication backend settings too)
          type: ldap
          config:
            # enable ldaps
            enable_ssl: false
            # enable start tls, enable_ssl should be false
            enable_start_tls: false
            # send client certificate
            enable_ssl_client_auth: false
            # verify ldap hostname
            verify_hostnames: true
            hosts:
            - localhost:8389
            bind_dn: null
            password: null
            rolebase: 'ou=groups,dc=example,dc=com'
            # Filter to search for roles (currently in the whole subtree beneath rolebase)
            # {0} is substituted with the DN of the user
            # {1} is substituted with the username
            # {2} is substituted with an attribute value from user's directory entry, of the authenticated user. Use userroleattribute to specify the name of the attribute
            rolesearch: '(member={0})'
            # Specify the name of the attribute which value should be substituted with {2} above
            userroleattribute: null
            # Roles as an attribute of the user entry
            userrolename: disabled
            #userrolename: memberOf
            # The attribute in a role entry containing the name of that role, Default is "name".
            # Can also be "dn" to use the full DN as rolename.
            rolename: cn
            # Resolve nested roles transitive (roles which are members of other roles and so on ...)
            resolve_nested_roles: true
            userbase: 'ou=people,dc=example,dc=com'
            # Filter to search for users (currently in the whole subtree beneath userbase)
            # {0} is substituted with the username
            usersearch: '(uid={0})'
            # Skip users matching a user name, a wildcard or a regex pattern
            #skip_users:
            #  - 'cn=Michael Jackson,ou*people,o=TEST'
            #  - '/\S*/'
      roles_from_another_ldap:
        description: "Authorize via another Active Directory"
        http_enabled: false
        transport_enabled: false
        authorization_backend:
          type: ldap
          #config goes here ...
  #    auth_failure_listeners:
  #      ip_rate_limiting:
  #        type: ip
  #        allowed_tries: 10
  #        time_window_seconds: 3600
  #        block_expiry_seconds: 600
  #        max_blocked_clients: 100000
  #        max_tracked_clients: 100000
  #      internal_authentication_backend_limiting:
  #        type: username
  #        authentication_backend: intern
  #        allowed_tries: 10
  #        time_window_seconds: 3600
  #        block_expiry_seconds: 600
  #        max_blocked_clients: 100000
  #        max_tracked_clients: 100000

I used these instructions to install OpenDistro Elasticsearch environment.

Everything is running well, and the setup was easy to install.
I also configured self-signed certificates from these instructions below. That also worked great in my environment.

https://opendistro.github.io/for-elasticsearch-docs/old/0.9.0/docs/security/generate-certificates/#generate-private-key

Once all the configurations are completed I restarted Kibana service (systemctl restart kinbana).

Chrome Browser shows this.

{"statusCode":500,"error":"Internal Server Error","message":"Internal Error"}
I did not notice any Warnings or Errors in my Elasticsearch log file that would pertain to this issue.
In my kibana.log file I did see these error’s

kibana.logs
{"type":"response","@timestamp":"2021-07-15T02:44:09Z","tags":[],"pid":50516,"method":"get","statusCode":401,"req":{"url":"/favicon.ico","method":"get","headers":{"host":"elastic-stack.enseva-labs.net:5601","connection":"keep-alive","pragma":"no-cache","cache-control":"no-cache","sec-ch-ua":"\" Not;A Brand\";v=\"99\", \"Google Chrome\";v=\"91\", \"Chromium\";v=\"91\"","sec-ch-ua-mobile":"?0","user-agent":"Mozilla/5.0 (Windows NT 10.0; Win64; x64) AppleWebKit/537.36 (KHTML, like Gecko) Chrome/91.0.4472.124 Safari/537.36","accept":"image/avif,image/webp,image/apng,image/svg+xml,image/*,*/*;q=0.8","sec-fetch-site":"same-origin","sec-fetch-mode":"no-cors","sec-fetch-dest":"image","referer":"https://elastic-stack.enseva-labs.net:5601/auth/saml/login?nextUrl=%2Fapp%2Fopendistro_security","accept-encoding":"gzip, deflate, br","accept-language":"en-US,en;q=0.9"},"remoteAddress":"10.200.6.67","userAgent":"Mozilla/5.0 (Windows NT 10.0; Win64; x64) AppleWebKit/537.36 (KHTML, like Gecko) Chrome/91.0.4472.124 Safari/537.36","referer":"https://elastic-stack.enseva-labs.net:5601/auth/saml/login?nextUrl=%2Fapp%2Fopendistro_security"},"res":{"statusCode":401,"responseTime":1,"contentLength":9},"message":"GET /favicon.ico 401 1ms - 9.0B"}
{"type":"error","@timestamp":"2021-07-15T02:55:45Z","tags":["connection","client","error"],"pid":50516,"level":"error","error":{"message":"140710813779776:error:14094416:SSL routines:ssl3_read_bytes:sslv3 alert certificate unknown:../deps/openssl/openssl/ssl/record/rec_layer_s3.c:1544:SSL alert number 46\n","name":"Error","stack":"Error: 140710813779776:error:14094416:SSL routines:ssl3_read_bytes:sslv3 alert certificate unknown:../deps/openssl/openssl/ssl/record/rec_layer_s3.c:1544:SSL alert number 46\n"},"message":"140710813779776:error:14094416:SSL routines:ssl3_read_bytes:sslv3 alert certificate unknown:../deps/openssl/openssl/ssl/record/rec_layer_s3.c:1544:SSL alert number 46\n"}
{"type":"log","@timestamp":"2021-07-15T02:55:45Z","tags":["error","plugins","opendistroSecurityKibana"],"pid":50516,"message":"Failed to get saml header: Error: Error: failed parsing SAML config"}
{"type":"error","@timestamp":"2021-07-15T02:55:45Z","tags":[],"pid":50516,"level":"error","error":{"message":"Internal Server Error","name":"Error","stack":"Error: Internal Server Error\n    at HapiResponseAdapter.toError (/usr/share/kibana/src/core/server/http/router/response_adapter.js:132:19)\n    at HapiResponseAdapter.toHapiResponse (/usr/share/kibana/src/core/server/http/router/response_adapter.js:86:19)\n    at HapiResponseAdapter.handle (/usr/share/kibana/src/core/server/http/router/response_adapter.js:81:17)\n    at Router.handle (/usr/share/kibana/src/core/server/http/router/router.js:164:34)\n    at process._tickCallback (internal/process/next_tick.js:68:7)"},"url":{"protocol":null,"slashes":null,"auth":null,"host":null,"port":null,"hostname":null,"hash":null,"search":"?nextUrl=%2Fapp%2Fopendistro_security","query":{"nextUrl":"/app/opendistro_security"},"pathname":"/auth/saml/login","path":"/auth/saml/login?nextUrl=%2Fapp%2Fopendistro_security","href":"/auth/saml/login?nextUrl=%2Fapp%2Fopendistro_security"},"message":"Internal Server Error"}
{"type":"response","@timestamp":"2021-07-15T02:55:45Z","tags":[],"pid":50516,"method":"get","statusCode":500,"req":{"url":"/auth/saml/login?nextUrl=%2Fapp%2Fopendistro_security","method":"get","headers":{"host":"elastic-stack.enseva-labs.net:5601","connection":"keep-alive","cache-control":"max-age=0","sec-ch-ua":"\" Not;A Brand\";v=\"99\", \"Google Chrome\";v=\"91\", \"Chromium\";v=\"91\"","sec-ch-ua-mobile":"?0","upgrade-insecure-requests":"1","user-agent":"Mozilla/5.0 (Windows NT 10.0; Win64; x64) AppleWebKit/537.36 (KHTML, like Gecko) Chrome/91.0.4472.124 Safari/537.36","accept":"text/html,application/xhtml+xml,application/xml;q=0.9,image/avif,image/webp,image/apng,*/*;q=0.8,application/signed-exchange;v=b3;q=0.9","sec-fetch-site":"cross-site","sec-fetch-mode":"navigate","sec-fetch-user":"?1","sec-fetch-dest":"document","referer":"https://elastic-stack.enseva-labs.net:5601/auth/saml/login?nextUrl=%2Fapp%2Fopendistro_security","accept-encoding":"gzip, deflate, br","accept-language":"en-US,en;q=0.9"},"remoteAddress":"10.200.6.67","userAgent":"Mozilla/5.0 (Windows NT 10.0; Win64; x64) AppleWebKit/537.36 (KHTML, like Gecko) Chrome/91.0.4472.124 Safari/537.36","referer":"https://elastic-stack.enseva-labs.net:5601/auth/saml/login?nextUrl=%2Fapp%2Fopendistro_security"},"res":{"statusCode":500,"responseTime":15,"contentLength":9},"message":"GET /auth/saml/login?nextUrl=%2Fapp%2Fopendistro_security 500 15ms - 9.0B"}
{"type":"response","@timestamp":"2021-07-15T02:55:45Z","tags":[],"pid":50516,"method":"get","statusCode":401,"req":{"url":"/favicon.ico","method":"get","headers":{"host":"elastic-stack.enseva-labs.net:5601","connection":"keep-alive","pragma":"no-cache","cache-control":"no-cache","sec-ch-ua":"\" Not;A Brand\";v=\"99\", \"Google Chrome\";v=\"91\", \"Chromium\";v=\"91\"","sec-ch-ua-mobile":"?0","user-agent":"Mozilla/5.0 (Windows NT 10.0; Win64; x64) AppleWebKit/537.36 (KHTML, like Gecko) Chrome/91.0.4472.124 Safari/537.36","accept":"image/avif,image/webp,image/apng,image/svg+xml,image/*,*/*;q=0.8","sec-fetch-site":"same-origin","sec-fetch-mode":"no-cors","sec-fetch-dest":"image","referer":"https://elastic-stack.enseva-labs.net:5601/auth/saml/login?nextUrl=%2Fapp%2Fopendistro_security","accept-encoding":"gzip, deflate, br","accept-language":"en-US,en;q=0.9"},"remoteAddress":"10.200.6.67","userAgent":"Mozilla/5.0 (Windows NT 10.0; Win64; x64) AppleWebKit/537.36 (KHTML, like Gecko) Chrome/91.0.4472.124 Safari/537.36","referer":"https://elastic-stack.enseva-labs.net:5601/auth/saml/login?nextUrl=%2Fapp%2Fopendistro_security"},"res":{"statusCode":401,"responseTime":3,"contentLength":9},"message":"GET /favicon.ico 401 3ms - 9.0B"}

To sum it up
I installed elasticsearch and Kibana from OpenDistro Documentation along with creating my self-signed certificates. Once that was completed, I sent Logs to my server to make sure it was functioning. No problems were found, and the instruction worked great.

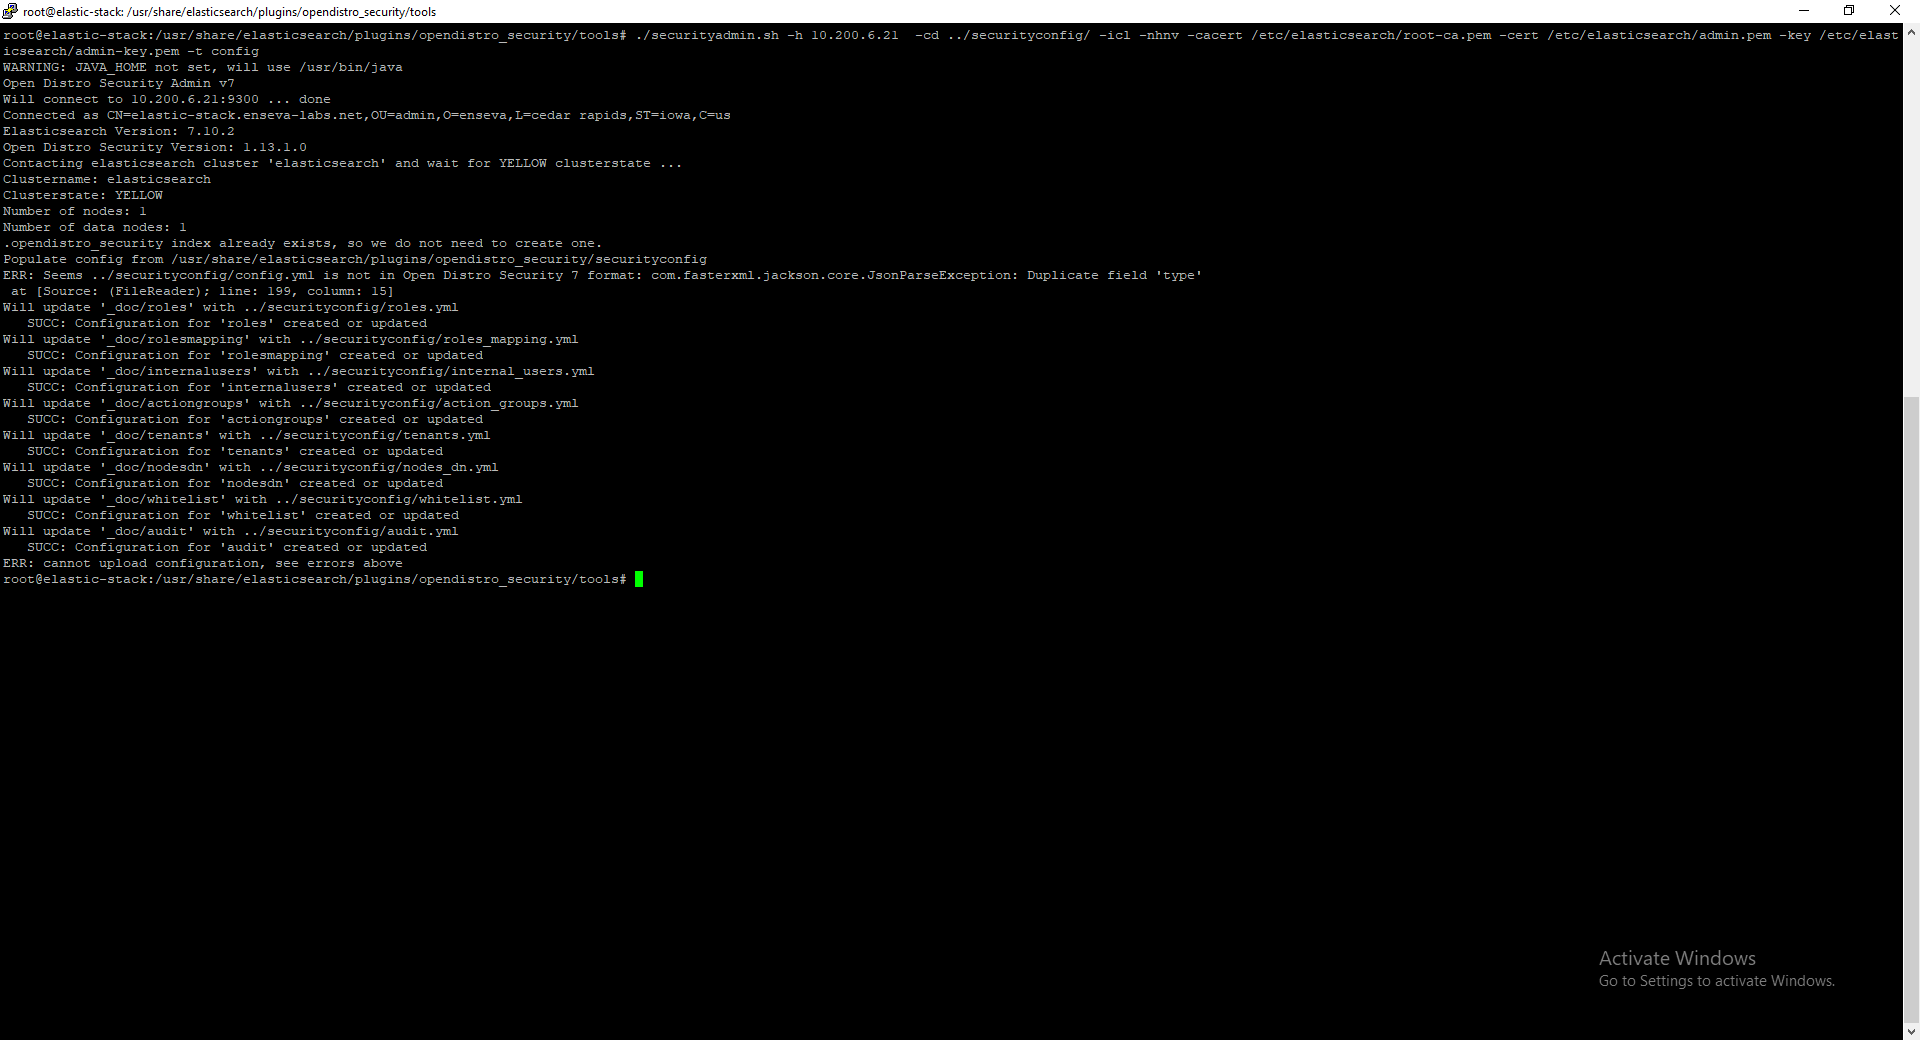
Then I proceeded to configure the server to use SAML by following the instruction that’s when problems occurred.

Problems occured when I uncommented this line in Kibana.yml.

opendistro_security.auth.type: saml

At first, I didn’t notice any errors until I reloaded my browser then they were shown as I stated above.

Any Advice or direction to solve this would be appreciated.
Thank you in advance.

@Gsmitt Could you please change the challenge flag in basic auth from true to false, so that it would continue on to the next authentication, in this case saml.

Also, can you try to use metadata_url instead of metadata_file, as any changes made from saml side will not be reflected and could cause issues down the line, especially during initial testing.

Don’t forget to upload the changes via securityadmin.sh script.

1 Like

Thank you for the reply. I was able to get a little further.
I adjusted the configuration as suggested plus I also had to remove the "/”.

Was set as:
kibana_url: https://elastic-stack.enseva-labs.net:5601/

New confgiuration.
kibana_url: https://elastic-stack.enseva-labs.net:5601
Then I executed securityadmin.sh script.

config.yml
saml_auth_domain:
        order: 1
        description: "SAML provider"
        http_enabled: true
        transport_enabled: false
        http_authenticator:
          type: saml
          challenge: true
          config:
            idp:
              metadata_url: http://keycloak.enseva-labs.net:8080/auth/realms/elastic/protocol/saml/descriptor
              entity_id: http://keycloak.enseva-labs.net:8080/auth/realms/elastic
            sp:
              entity_id: kibana-saml
              forceAuthn: true
            kibana_url: https://elastic-stack.enseva-labs.net:5601
            roles_key: Role
            exchange_key: 0a782e54-cd07-44ff-9c3f-e9d1824fe478
        authentication_backend:
          type: noop

I navigated to my Elasticsearch server FQDN. When I hit “Enter” button it redirects to Keycloak immediately.

Insert Username and password:

I click on “Sign In”.

I received the following error after redirecting back to Kibana.

{"statusCode":500,"error":"Internal Server Error","message":"Internal Error"}

Here are the service logs after a kibana restart. Trying to logon.

kibana.service.logs

Jul 15 20:12:33 elastic-stack systemd[1]: Stopping Kibana...
Jul 15 20:12:33 elastic-stack systemd[1]: Stopped Kibana.
Jul 15 20:12:33 elastic-stack systemd[1]: Started Kibana.
Jul 15 20:12:54 elastic-stack kibana[62846]: { Error: Authentication Exception
Jul 15 20:12:54 elastic-stack kibana[62846]:     at respond (/usr/share/kibana/node_modules/elasticsearch/src/lib/transport.js:349:15)
Jul 15 20:12:54 elastic-stack kibana[62846]:     at checkRespForFailure (/usr/share/kibana/node_modules/elasticsearch/src/lib/transport.js:306:7)
Jul 15 20:12:54 elastic-stack kibana[62846]:     at HttpConnector.<anonymous> (/usr/share/kibana/node_modules/elasticsearch/src/lib/connectors/http.js:173:7)
Jul 15 20:12:54 elastic-stack kibana[62846]:     at IncomingMessage.wrapper (/usr/share/kibana/node_modules/lodash/lodash.js:4949:19)
Jul 15 20:12:54 elastic-stack kibana[62846]:     at IncomingMessage.emit (events.js:203:15)
Jul 15 20:12:54 elastic-stack kibana[62846]:     at endReadableNT (_stream_readable.js:1145:12)
Jul 15 20:12:54 elastic-stack kibana[62846]:     at process._tickCallback (internal/process/next_tick.js:63:19)
Jul 15 20:12:54 elastic-stack kibana[62846]:   status: 401,
Jul 15 20:12:54 elastic-stack kibana[62846]:   displayName: 'AuthenticationException',
Jul 15 20:12:54 elastic-stack kibana[62846]:   message: 'Authentication Exception',
Jul 15 20:12:54 elastic-stack kibana[62846]:   path: '/_opendistro/_security/api/authtoken',
Jul 15 20:12:54 elastic-stack kibana[62846]:   query: {},
Jul 15 20:12:54 elastic-stack kibana[62846]:   body: undefined,
Jul 15 20:12:54 elastic-stack kibana[62846]:   statusCode: 401,
Jul 15 20:12:54 elastic-stack kibana[62846]:   response: '',
Jul 15 20:12:54 elastic-stack kibana[62846]:   wwwAuthenticateDirective:
Jul 15 20:12:54 elastic-stack kibana[62846]:    'X-Security-IdP realm="Open Distro Security" location="http://keycloak.enseva-labs.net:8080/auth/realms/elastic/protocol/saml?SAMLRe
Jul 15 20:12:54 elastic-stack kibana[62846]:   toString: [Function],
Jul 15 20:12:54 elastic-stack kibana[62846]:   toJSON: [Function],
Jul 15 20:12:54 elastic-stack kibana[62846]:   isBoom: true,
Jul 15 20:12:54 elastic-stack kibana[62846]:   isServer: false,
Jul 15 20:12:54 elastic-stack kibana[62846]:   data: null,
Jul 15 20:12:54 elastic-stack kibana[62846]:   output:
Jul 15 20:12:54 elastic-stack kibana[62846]:    { statusCode: 401,
Jul 15 20:12:54 elastic-stack kibana[62846]:      payload:
Jul 15 20:12:54 elastic-stack kibana[62846]:       { statusCode: 401,
Jul 15 20:12:54 elastic-stack kibana[62846]:         error: 'Unauthorized',
Jul 15 20:12:54 elastic-stack kibana[62846]:         message: 'Authentication Exception' },
Jul 15 20:12:54 elastic-stack kibana[62846]:      headers:
Jul 15 20:12:54 elastic-stack kibana[62846]:       { 'WWW-Authenticate': 'Basic realm="Authorization Required"' } },
Jul 15 20:12:54 elastic-stack kibana[62846]:   reformat: [Function],
Jul 15 20:12:54 elastic-stack kibana[62846]:   [Symbol(ElasticsearchError)]: 'Elasticsearch/notAuthorized' }

This is the kibana log file after restart.

kibana.log.file

{"type":"log","@timestamp":"2021-07-16T01:12:33Z","tags":["info","plugins-system"],"pid":61756,"message":"Stopping all plugins."}
{"type":"log","@timestamp":"2021-07-16T01:12:43Z","tags":["info","plugins-service"],"pid":62846,"message":"Plugin \"telemetryManagementSection\" has been disabled since the following direct or transitive dependencies are missing or disabled: [telemetry]"}
{"type":"log","@timestamp":"2021-07-16T01:12:43Z","tags":["info","plugins-service"],"pid":62846,"message":"Plugin \"newsfeed\" is disabled."}
{"type":"log","@timestamp":"2021-07-16T01:12:43Z","tags":["info","plugins-service"],"pid":62846,"message":"Plugin \"telemetry\" is disabled."}
{"type":"log","@timestamp":"2021-07-16T01:12:43Z","tags":["info","plugins-service"],"pid":62846,"message":"Plugin \"visTypeXy\" is disabled."}
{"type":"log","@timestamp":"2021-07-16T01:12:44Z","tags":["warning","config","deprecation"],"pid":62846,"message":"It is not recommended to disable xsrf protections for API endpoints via [server.xsrf.whitelist]. It will be removed in 8.0 release. Instead, supply the \"kbn-xsrf\" header."}
{"type":"log","@timestamp":"2021-07-16T01:12:44Z","tags":["info","plugins-system"],"pid":62846,"message":"Setting up [47] plugins: [opendistroAlertingKibana,securityOss,usageCollection,kibanaUsageCollection,telemetryCollectionManager,mapsLegacy,kibanaLegacy,share,expressions,data,home,apmOss,console,management,indexPatternManagement,advancedSettings,savedObjects,opendistroSecurityKibana,opendistroAnomalyDetectionKibana,opendistroIndexManagementKibana,opendistroReportsKibana,opendistroTraceAnalyticsKibana,opendistroQueryWorkbenchKibana,charts,legacyExport,embeddable,dashboard,opendistroNotebooksKibana,visualizations,visTypeTagcloud,visTypeTimeseries,visTypeVislib,visTypeVega,visTypeMarkdown,visTypeTable,visTypeMetric,visTypeTimelion,timelion,tileMap,regionMap,inputControlVis,opendistroGanttChartKibana,visualize,discover,savedObjectsManagement,esUiShared,bfetch]"}
{"type":"log","@timestamp":"2021-07-16T01:12:44Z","tags":["info","savedobjects-service"],"pid":62846,"message":"Waiting until all Elasticsearch nodes are compatible with Kibana before starting saved objects migrations..."}
{"type":"log","@timestamp":"2021-07-16T01:12:44Z","tags":["info","savedobjects-service"],"pid":62846,"message":"Starting saved objects migrations"}
{"type":"log","@timestamp":"2021-07-16T01:12:45Z","tags":["info","plugins-system"],"pid":62846,"message":"Starting [47] plugins: [opendistroAlertingKibana,securityOss,usageCollection,kibanaUsageCollection,telemetryCollectionManager,mapsLegacy,kibanaLegacy,share,expressions,data,home,apmOss,console,management,indexPatternManagement,advancedSettings,savedObjects,opendistroSecurityKibana,opendistroAnomalyDetectionKibana,opendistroIndexManagementKibana,opendistroReportsKibana,opendistroTraceAnalyticsKibana,opendistroQueryWorkbenchKibana,charts,legacyExport,embeddable,dashboard,opendistroNotebooksKibana,visualizations,visTypeTagcloud,visTypeTimeseries,visTypeVislib,visTypeVega,visTypeMarkdown,visTypeTable,visTypeMetric,visTypeTimelion,timelion,tileMap,regionMap,inputControlVis,opendistroGanttChartKibana,visualize,discover,savedObjectsManagement,esUiShared,bfetch]"}
{"type":"log","@timestamp":"2021-07-16T01:12:46Z","tags":["listening","info"],"pid":62846,"message":"Server running at https://10.200.6.21:5601"}
{"type":"log","@timestamp":"2021-07-16T01:12:46Z","tags":["info","http","server","Kibana"],"pid":62846,"message":"http server running at https://10.200.6.21:5601"}
{"type":"log","@timestamp":"2021-07-16T01:12:54Z","tags":["error","plugins","opendistroSecurityKibana"],"pid":62846,"message":"SAML SP initiated authentication workflow failed: Error: failed to get token"}
{"type":"error","@timestamp":"2021-07-16T01:12:54Z","tags":[],"pid":62846,"level":"error","error":{"message":"Internal Server Error","name":"Error","stack":"Error: Internal Server Error\n    at HapiResponseAdapter.toError (/usr/share/kibana/src/core/server/http/router/response_adapter.js:132:19)\n    at HapiResponseAdapter.toHapiResponse (/usr/share/kibana/src/core/server/http/router/response_adapter.js:86:19)\n    at HapiResponseAdapter.handle (/usr/share/kibana/src/core/server/http/router/response_adapter.js:81:17)\n    at Router.handle (/usr/share/kibana/src/core/server/http/router/router.js:164:34)\n    at process._tickCallback (internal/process/next_tick.js:68:7)"},"url":{"protocol":null,"slashes":null,"auth":null,"host":null,"port":null,"hostname":null,"hash":null,"search":null,"query":{},"pathname":"/_opendistro/_security/saml/acs","path":"/_opendistro/_security/saml/acs","href":"/_opendistro/_security/saml/acs"},"message":"Internal Server Error"}
{"type":"response","@timestamp":"2021-07-16T01:12:54Z","tags":[],"pid":62846,"method":"post","statusCode":500,"req":{"url":"/_opendistro/_security/saml/acs","method":"post","headers":{"host":"elastic-stack.enseva-labs.net:5601","user-agent":"Mozilla/5.0 (Windows NT 10.0; Win64; x64; rv:89.0) Gecko/20100101 Firefox/89.0","accept":"text/html,application/xhtml+xml,application/xml;q=0.9,image/webp,*/*;q=0.8","accept-language":"en-US,en;q=0.5","accept-encoding":"gzip, deflate, br","content-type":"application/x-www-form-urlencoded","content-length":"16481","origin":"null","connection":"keep-alive","upgrade-insecure-requests":"1","cache-control":"max-age=0"},"remoteAddress":"10.200.6.67","userAgent":"Mozilla/5.0 (Windows NT 10.0; Win64; x64; rv:89.0) Gecko/20100101 Firefox/89.0"},"res":{"statusCode":500,"responseTime":134,"contentLength":9},"message":"POST /_opendistro/_security/saml/acs 500 134ms - 9.0B"}

Tailed elasticsearch log file while trying to logon from the Web UI. I did recieve and error & warning but not sure what going on.

ES.log.file
root@elastic-stack:~# tail -f /var/log/elasticsearch/elasticsearch.log
[2021-07-15T20:25:18,539][INFO ][stats_log                ] [elastic-stack] ------------------------------------------------------------------------
Program=PerformanceAnalyzerPlugin
rca-version=0.0.1
Metrics=
StartTime=0.000
EndTime=Thu, 15 Jul 2021 20:25:18 CDT
Time=1626398718539 msecs
Timing=total-time:1.626398718539E12/1
Counters=
EOE
[2021-07-15T20:25:31,482][ERROR][c.o.s.a.SamlResponse     ] [elastic-stack] Could not validate timestamp: expired. Check system clock.
[2021-07-15T20:25:31,482][WARN ][c.a.d.a.h.s.AuthTokenProcessorHandler] [elastic-stack] Error while validating SAML response in /_opendistro/_security/api/authtoken
[2021-07-15T20:25:43,597][INFO ][c.a.o.i.i.ManagedIndexRunner] [elastic-stack] Executing attempt_transition for winlogbeat-7.10.2-2021.07.09
[2021-07-15T20:25:43,597][INFO ][c.a.o.i.i.ManagedIndexRunner] [elastic-stack] Finished executing attempt_transition for winlogbeat-7.10.2-2021.07.09
[2021-07-15T20:25:43,692][INFO ][c.a.o.i.i.ManagedIndexRunner] [elastic-stack] Executing attempt_transition for winlogbeat-7.10.2-2021.07.10
[2021-07-15T20:25:43,692][INFO ][c.a.o.i.i.ManagedIndexRunner] [elastic-stack] Finished executing attempt_transition for winlogbeat-7.10.2-2021.07.10

I tried researching the following but was unsuccessful in find where the issue was.

statusCode: 401,Jul 15 20:12:54 elastic-stack kibana[62846]:  error: 'Unauthorized',Jul 15 20:12:54 elastic-stack kibana[62846]:   message: 'Authentication Exception'

WWW-Authenticate: Basic realm=Authorization Required
Symbol(ElasticsearchError)]: Elasticsearch/notAuthorized

I’m running Keycloak version 13.0.0
Here is my Keycloak setup.


I’m not sure what missing. After looking at all the log I assume there is sometype of credential missing but dont know where to look or how to fix this.

Most configuration examples I found were using OpenID-connect or it lead me to Elastic-stack with X-pack.

Any advice or direction would be apperciated
Thanks again

@Gsmitt
You can set saml login to debug and extract and examine saml response and created jwt by adding below lines to log4j file in config and restarting the node.

logger.token.name = com.amazon.dlic.auth.http.saml.Token
logger.token.level = debug

As I can’t seem to reproduce your issue, below is example of replies I get in my local dev:

<samlp:Response xmlns:samlp="urn:oasis:names:tc:SAML:2.0:protocol" xmlns:saml="urn:oasis:names:tc:SAML:2.0:assertion" Destination="http://localhost:5601/_opendistro/_security/saml/acs" ID="ID_1e74fc51-7e61-410d-a538-889dfb231473" InResponseTo="ONELOGIN_5198d965-462b-42e2-9989-52c1e4454873" IssueInstant="2021-07-16T08:13:02.884Z" Version="2.0"><saml:Issuer>http://192.168.1.9:8080/auth/realms/realm_for_saml</saml:Issuer><dsig:Signature xmlns:dsig="http://www.w3.org/2000/09/xmldsig#"><dsig:SignedInfo><dsig:CanonicalizationMethod Algorithm="http://www.w3.org/2001/10/xml-exc-c14n#"/><dsig:SignatureMethod Algorithm="http://www.w3.org/2001/04/xmldsig-more#rsa-sha256"/><dsig:Reference URI="#ID_1e74fc51-7e61-410d-a538-889dfb231473"><dsig:Transforms><dsig:Transform Algorithm="http://www.w3.org/2000/09/xmldsig#enveloped-signature"/><dsig:Transform Algorithm="http://www.w3.org/2001/10/xml-exc-c14n#"/></dsig:Transforms><dsig:DigestMethod Algorithm="http://www.w3.org/2001/04/xmlenc#sha256"/><dsig:DigestValue>BMVX49sX8ze/g55RslsD1R1KHCb5/Ygo/N5D2SiywBk=</dsig:DigestValue></dsig:Reference></dsig:SignedInfo><dsig:SignatureValue>Z2lEm0gw1fHPNLY3vMT6NJiGHjZWV/OYpGDnnnUFYN0qLQm8cQlr4gaMCCV3F7aJe18F1HvlXftpnXgeM95wqyDJKj2NZoclDWtnZ6ExgQIg9yUYIslY5Eoux7wikXDVMXs8GM2KCUTpq9DBaJRhfQHscVszIuy9TFoFhBxAHQ7cHR3+vH+hNw66gB9MxVxN6onPyR2pGrgZfEhDtJGLj9yBhTH5kCY39Wvp1xkXfX0abePK3ke0CwK6eUpaCMt/lYqyAw3g1tiLATzy6tZckhcT38K+WuuBsT8PTqmTFJz6ydIO35z/RriLLBU2UcslZofc903Q+9OP3igYVAAcow==</dsig:SignatureValue><dsig:KeyInfo><dsig:KeyName>KflqydJGMn-fcSlQV2tybJc_fOifzq2TZmIsJlwSbmA</dsig:KeyName><dsig:X509Data><dsig:X509Certificate>MIICqzCCAZMCBgF2dgr8WjANBgkqhkiG9w0BAQsFADAZMRcwFQYDVQQDDA5yZWFsbV9mb3Jfc2FtbDAeFw0yMDEyMTgxMzI4MjBaFw0zMDEyMTgxMzMwMDBaMBkxFzAVBgNVBAMMDnJlYWxtX2Zvcl9zYW1sMIIBIjANBgkqhkiG9w0BAQEFAAOCAQ8AMIIBCgKCAQEAunjhOyDsvwg3xUSpkeA43+1PBsPvnb5ajndM64PWwvuprK25874uF+0IgkIjf1KzIagWtM460MWX9zQIEnz4unr0vJ/Ts3zTRqrb48D/D1KXN1v2z6mJO67Ko+lGrtbI+E2z/1gSHw3OMgl51KXtdVFqEaR+TkP/HGV0fQpkttHHljNlLo3GDG5khlyrESYAKcIFsWsR/namthEeyRIf408MDBOoRWaaxKsazQ2zUL2MRvCwewS3ND/ksc9eGCUiOaYPF0+D7Dm7n6uwUQ0decZnIsfQS6uEePqrTYlIFmWNF9H2gZtVHkS4jtMwGA6wmAvkIAwdJaHCRN7x3mRCAQIDAQABMA0GCSqGSIb3DQEBCwUAA4IBAQBDrBfTLc6c8LKFMVA1RtKuf16jSHKZAolsZNEcp8d8qURr49FQaVmTL6SpsJlOO/5Svr1c12ehyvG++BU5MXd7OmRsLTtzCRzlYYL4aJwwYjO7EDvyIJfTnVOC3wf+olFv9WDt7Gaci2zAdJBMh+fYgooi9SRmWeOLYlAuu3DS3arnoXjW4+hTL6oxYLa74E81Up4DmN3hPrDfA1rqb0SKxsVrhL1oPhaTqxluGqnTlF1U/cjCzajkpZ+lgUUX1IAov9xsaqpgXglQwDlv7AuIvKzWzQVhkxANzah9P3Vd/p9NgOewdFqSqcnzrAc5fGPfvRF169kFcBgQCs2GAaCV</dsig:X509Certificate></dsig:X509Data><dsig:KeyValue><dsig:RSAKeyValue><dsig:Modulus>unjhOyDsvwg3xUSpkeA43+1PBsPvnb5ajndM64PWwvuprK25874uF+0IgkIjf1KzIagWtM460MWX9zQIEnz4unr0vJ/Ts3zTRqrb48D/D1KXN1v2z6mJO67Ko+lGrtbI+E2z/1gSHw3OMgl51KXtdVFqEaR+TkP/HGV0fQpkttHHljNlLo3GDG5khlyrESYAKcIFsWsR/namthEeyRIf408MDBOoRWaaxKsazQ2zUL2MRvCwewS3ND/ksc9eGCUiOaYPF0+D7Dm7n6uwUQ0decZnIsfQS6uEePqrTYlIFmWNF9H2gZtVHkS4jtMwGA6wmAvkIAwdJaHCRN7x3mRCAQ==</dsig:Modulus><dsig:Exponent>AQAB</dsig:Exponent></dsig:RSAKeyValue></dsig:KeyValue></dsig:KeyInfo></dsig:Signature><samlp:Status><samlp:StatusCode Value="urn:oasis:names:tc:SAML:2.0:status:Success"/></samlp:Status><saml:Assertion xmlns="urn:oasis:names:tc:SAML:2.0:assertion" ID="ID_eaabda76-d977-41a0-a8c3-712f84e41daf" IssueInstant="2021-07-16T08:13:02.883Z" Version="2.0"><saml:Issuer>http://192.168.1.9:8080/auth/realms/realm_for_saml</saml:Issuer><saml:Subject><saml:NameID Format="urn:oasis:names:tc:SAML:1.1:nameid-format:unspecified">anton</saml:NameID><saml:SubjectConfirmation Method="urn:oasis:names:tc:SAML:2.0:cm:bearer"><saml:SubjectConfirmationData InResponseTo="ONELOGIN_5198d965-462b-42e2-9989-52c1e4454873" NotOnOrAfter="2021-07-16T08:18:00.883Z" Recipient="http://localhost:5601/_opendistro/_security/saml/acs"/></saml:SubjectConfirmation></saml:Subject><saml:Conditions NotBefore="2021-07-16T08:13:00.883Z" NotOnOrAfter="2021-07-16T08:18:00.883Z"><saml:AudienceRestriction><saml:Audience>KibanaSAML</saml:Audience></saml:AudienceRestriction></saml:Conditions><saml:AuthnStatement AuthnInstant="2021-07-16T08:13:02.884Z" SessionIndex="5a38feb8-a0ce-4d05-a4d5-043aec545717::ac543be1-bf9d-411c-b3a3-483252cacbc0" SessionNotOnOrAfter="2021-07-16T13:13:02.884Z"><saml:AuthnContext><saml:AuthnContextClassRef>urn:oasis:names:tc:SAML:2.0:ac:classes:unspecified</saml:AuthnContextClassRef></saml:AuthnContext></saml:AuthnStatement><saml:AttributeStatement><saml:Attribute Name="Role" NameFormat="urn:oasis:names:tc:SAML:2.0:attrname-format:basic"><saml:AttributeValue xmlns:xs="http://www.w3.org/2001/XMLSchema" xmlns:xsi="http://www.w3.org/2001/XMLSchema-instance" xsi:type="xs:string">admin</saml:AttributeValue><saml:AttributeValue xmlns:xs="http://www.w3.org/2001/XMLSchema" xmlns:xsi="http://www.w3.org/2001/XMLSchema-instance" xsi:type="xs:string">test</saml:AttributeValue></saml:Attribute></saml:AttributeStatement></saml:Assertion></samlp:Response>
odfe-node1    | [2021-07-16T08:13:03,017][DEBUG][c.a.d.a.h.s.Token        ] [odfe-node1] Created JWT: eyJhbGciOiJIUzUxMiJ9.eyJuYmYiOjE2MjY0MjMxODMsImV4cCI6MTYyNjQ0MTE4Miwic3ViIjoiYW50b24iLCJzYW1sX25pZiI6InUiLCJzYW1sX3NpIjoiNWEzOGZlYjgtYTBjZS00ZDA1LWE0ZDUtMDQzYWVjNTQ1NzE3OjphYzU0M2JlMS1iZjlkLTQxMWMtYjNhMy00ODMyNTJjYWNiYzAiLCJyb2xlcyI6WyJhZG1pbiIsInRlc3QiXX0.R9uM5Wc3t5uqaT0wQt1JNDnr1aukGmF5j6GjLTRxcNc4jfmxSYputTFrPcPBpHo0M1RL8TcrZ2kQ72W1tZH4kA

Are you able to extract your replies and compare?

1 Like

Hello,
I appreciate your time given.
Adjusted the log4j file to debug as suggested. I think something wacky is going on with my installment.

Kibana
{"type":"log","@timestamp":"2021-07-17T02:23:17Z","tags":["info","plugins-system"],"pid":6342,"message":"Setting up [47] plugins: [opendistroAlertingKibana,usageCollection,kibanaUsageCollection,telemetryCollectionManager,securityOss,mapsLegacy,kibanaLegacy,share,legacyExport,expressions,data,home,console,apmOss,management,indexPatternManagement,advancedSettings,savedObjects,opendistroSecurityKibana,opendistroIndexManagementKibana,opendistroAnomalyDetectionKibana,opendistroTraceAnalyticsKibana,opendistroQueryWorkbenchKibana,opendistroReportsKibana,embeddable,dashboard,opendistroNotebooksKibana,visualizations,visTypeVega,visTypeTimelion,timelion,visTypeTable,visTypeMarkdown,tileMap,regionMap,inputControlVis,visualize,opendistroGanttChartKibana,esUiShared,charts,visTypeVislib,visTypeTimeseries,visTypeMetric,visTypeTagcloud,discover,savedObjectsManagement,bfetch]"}
{"type":"log","@timestamp":"2021-07-17T02:23:17Z","tags":["info","savedobjects-service"],"pid":6342,"message":"Waiting until all Elasticsearch nodes are compatible with Kibana before starting saved objects migrations..."}
{"type":"log","@timestamp":"2021-07-17T02:23:17Z","tags":["error","elasticsearch","data"],"pid":6342,"message":"[ResponseError]: Response Error"}
{"type":"log","@timestamp":"2021-07-17T02:23:17Z","tags":["error","savedobjects-service"],"pid":6342,"message":"Unable to retrieve version information from Elasticsearch nodes."}
{"type":"log","@timestamp":"2021-07-17T02:23:20Z","tags":["error","elasticsearch","data"],"pid":6342,"message":"[ResponseError]: Response Error"}
{"type":"log","@timestamp":"2021-07-17T02:23:22Z","tags":["error","elasticsearch","data"],"pid":6342,"message":"[ResponseError]: Response Error"}
{"type":"log","@timestamp":"2021-07-17T02:23:25Z","tags":["error","elasticsearch","data"],"pid":6342,"message":"[ResponseError]: Response Error"}
{"type":"log","@timestamp":"2021-07-17T02:23:27Z","tags":["error","elasticsearch","data"],"pid":6342,"message":"[ResponseError]: Response Error"}
{"type":"log","@timestamp":"2021-07-17T02:23:30Z","tags":["error","elasticsearch","data"],"pid":6342,"message":"[ResponseError]: Response Error"}
{"type":"log","@timestamp":"2021-07-17T02:23:32Z","tags":["error","elasticsearch","data"],"pid":6342,"message":"[ResponseError]: Response Error"}
{"type":"log","@timestamp":"2021-07-17T02:23:35Z","tags":["error","elasticsearch","data"],"pid":6342,"message":"[ResponseError]: Response Error"}
{"type":"log","@timestamp":"2021-07-17T02:23:37Z","tags":["error","elasticsearch","data"],"pid":6342,"message":"[ResponseError]: Response Error"}
{"type":"log","@timestamp":"2021-07-17T02:23:40Z","tags":["error","elasticsearch","data"],"pid":6342,"message":"[ResponseError]: Response Error"}
{"type":"log","@timestamp":"2021-07-17T02:23:42Z","tags":["error","elasticsearch","data"],"pid":6342,"message":"[ResponseError]: Response Error"}
{"type":"log","@timestamp":"2021-07-17T02:23:45Z","tags":["error","elasticsearch","data"],"pid":6342,"message":"[ResponseError]: Response Error"}
{"type":"log","@timestamp":"2021-07-17T02:23:47Z","tags":["error","elasticsearch","data"],"pid":6342,"message":"[ResponseError]: Response Error"}
{"type":"log","@timestamp":"2021-07-17T02:23:50Z","tags":["error","elasticsearch","data"],"pid":6342,"message":"[ResponseError]: Response Error"}
{"type":"log","@timestamp":"2021-07-17T02:23:52Z","tags":["error","elasticsearch","data"],"pid":6342,"message":"[ResponseError]: Response Error"}
{"type":"log","@timestamp":"2021-07-17T02:23:55Z","tags":["error","elasticsearch","data"],"pid":6342,"message":"[ResponseError]: Response Error"}
{"type":"log","@timestamp":"2021-07-17T02:23:57Z","tags":["error","elasticsearch","data"],"pid":6342,"message":"[ResponseError]: Response Error"}
{"type":"log","@timestamp":"2021-07-17T02:24:00Z","tags":["error","elasticsearch","data"],"pid":6342,"message":"[ResponseError]: Response Error"}
{"type":"log","@timestamp":"2021-07-17T02:24:02Z","tags":["error","elasticsearch","data"],"pid":6342,"message":"[ResponseError]: Response Error"}
{"type":"log","@timestamp":"2021-07-17T02:24:05Z","tags":["error","elasticsearch","data"],"pid":6342,"message":"[ResponseError]: Response Error"}
{"type":"log","@timestamp":"2021-07-17T02:24:07Z","tags":["error","elasticsearch","data"],"pid":6342,"message":"[ResponseError]: Response Error"}
{"type":"log","@timestamp":"2021-07-17T02:24:10Z","tags":["error","elasticsearch","data"],"pid":6342,"message":"[ResponseError]: Response Error"}
{"type":"log","@timestamp":"2021-07-17T02:24:12Z","tags":["error","elasticsearch","data"],"pid":6342,"message":"[ResponseError]: Response Error"}
{"type":"log","@timestamp":"2021-07-17T02:24:15Z","tags":["error","elasticsearch","data"],"pid":6342,"message":"[ResponseError]: Response Error"}
{"type":"log","@timestamp":"2021-07-17T02:24:17Z","tags":["error","elasticsearch","data"],"pid":6342,"message":"[ResponseError]: Response Error"}
{"type":"log","@timestamp":"2021-07-17T02:24:20Z","tags":["error","elasticsearch","data"],"pid":6342,"message":"[ResponseError]: Response Error"}
{"type":"log","@timestamp":"2021-07-17T02:24:22Z","tags":["error","elasticsearch","data"],"pid":6342,"message":"[ResponseError]: Response Error"}
{"type":"log","@timestamp":"2021-07-17T02:24:25Z","tags":["error","elasticsearch","data"],"pid":6342,"message":"[ResponseError]: Response Error"}
{"type":"log","@timestamp":"2021-07-17T02:24:27Z","tags":["error","elasticsearch","data"],"pid":6342,"message":"[ResponseError]: Response Error"}
{"type":"log","@timestamp":"2021-07-17T02:24:30Z","tags":["error","elasticsearch","data"],"pid":6342,"message":"[ResponseError]: Response Error"}
{"type":"log","@timestamp":"2021-07-17T02:24:32Z","tags":["error","elasticsearch","data"],"pid":6342,"message":"[ResponseError]: Response Error"}
{"type":"log","@timestamp":"2021-07-17T02:24:35Z","tags":["error","elasticsearch","data"],"pid":6342,"message":"[ResponseError]: Response Error"}
{"type":"log","@timestamp":"2021-07-17T02:24:37Z","tags":["error","elasticsearch","data"],"pid":6342,"message":"[ResponseError]: Response Error"}
{"type":"log","@timestamp":"2021-07-17T02:24:40Z","tags":["error","elasticsearch","data"],"pid":6342,"message":"[ResponseError]: Response Error"}
{"type":"log","@timestamp":"2021-07-17T02:24:42Z","tags":["error","elasticsearch","data"],"pid":6342,"message":"[ResponseError]: Response Error"}
{"type":"log","@timestamp":"2021-07-17T02:24:45Z","tags":["error","elasticsearch","data"],"pid":6342,"message":"[ResponseError]: Response Error"}
{"type":"log","@timestamp":"2021-07-17T02:24:47Z","tags":["error","elasticsearch","data"],"pid":6342,"message":"[ResponseError]: Response Error"}
{"type":"log","@timestamp":"2021-07-17T02:24:50Z","tags":["error","elasticsearch","data"],"pid":6342,"message":"[ResponseError]: Response Error"}
{"type":"log","@timestamp":"2021-07-17T02:24:52Z","tags":["error","elasticsearch","data"],"pid":6342,"message":"[ResponseError]: Response Error"}

Over the weekend I’m going to wipe this VM and start over while using all the information in this post.
Since you cannot reproduce this issue, I believe this maybe be a user error on my part.
I’ve been testing this ES server for about two weeks now on different configurations and might have screwed something up and/or forgot to put configuration back.
I will reply back when this is done, and Thank you again @Anthony

@Anthony
Hello,

Sorry for the delay. I did get a new node running.I created a new virtual machine with Ubuntu 18.0.4 and install all updates.

Following this documentation for SAML configuration, I’m not using Docker this is a package installation.

Next, I created certificates.

certificates_created
openssl genrsa -out root-ca-key.pem 2048
openssl req -new -x509 -sha256 -key root-ca-key.pem -out root-ca.pem
openssl genrsa -out admin-key-temp.pem 2048
penssl pkcs8 -inform PEM -outform PEM -in admin-key-temp.pem -topk8 -nocrypt -v1 PBE-SHA1-3DES -out admin-key.pem
openssl req -new -key admin-key.pem -out admin.csr
openssl x509 -req -in admin.csr -CA root-ca.pem -CAkey root-ca-key.pem -CAcreateserial -sha256 -out admin.pem

My configuration files for Kibana and elasticsearch are identical from above.

As suggested in my log4j2.properties configuration.

Adjusted the config.yml file as suggested from above.

config.yml
_meta:
  type: "config"
  config_version: 2
config:
  dynamic:
    # Set filtered_alias_mode to 'disallow' to forbid more than 2 filtered aliases per index
    # Set filtered_alias_mode to 'warn' to allow more than 2 filtered aliases per index but warns about it (default)
    # Set filtered_alias_mode to 'nowarn' to allow more than 2 filtered aliases per index silently
    #filtered_alias_mode: warn
    #do_not_fail_on_forbidden: false
    #kibana:
    # Kibana multitenancy
    #multitenancy_enabled: true
    #server_username: kibanaserver
    #index: '.kibana'
    http:
      anonymous_auth_enabled: false
      xff:
        enabled: false
        internalProxies: '192\.168\.0\.10|192\.168\.0\.11' # regex pattern
        #internalProxies: '.*' # trust all internal proxies, regex pattern
        #remoteIpHeader:  'x-forwarded-for'
        ###### see https://docs.oracle.com/javase/7/docs/api/java/util/regex/Pattern.html for regex help
        ###### more information about XFF https://en.wikipedia.org/wiki/X-Forwarded-For
        ###### and here https://tools.ietf.org/html/rfc7239
        ###### and https://tomcat.apache.org/tomcat-8.0-doc/config/valve.html#Remote_IP_Valve
    authc:
      kerberos_auth_domain:
        http_enabled: false
        transport_enabled: false
        order: 6
        http_authenticator:
          type: kerberos
          challenge: true
          config:
            # If true a lot of kerberos/security related debugging output will be logged to standard out
            krb_debug: false
            # If true then the realm will be stripped from the user name
            strip_realm_from_principal: true
        authentication_backend:
          type: noop
      basic_internal_auth_domain:
        description: "Authenticate via HTTP Basic against internal users database"
        http_enabled: true
        transport_enabled: true
        order: 4
        http_authenticator:
          type: basic
          challenge: false
        authentication_backend:
          type: intern
      proxy_auth_domain:
        description: "Authenticate via proxy"
        http_enabled: false
        transport_enabled: false
        order: 3
        http_authenticator:
          type: proxy
          challenge: false
          config:
            user_header: "x-proxy-user"
            roles_header: "x-proxy-roles"
        authentication_backend:
          type: noop
      jwt_auth_domain:
        description: "Authenticate via Json Web Token"
        http_enabled: false
        transport_enabled: false
        order: 0
        http_authenticator:
          type: jwt
          challenge: false
          config:
            signing_key: "base64 encoded HMAC key or public RSA/ECDSA pem key"
            jwt_header: "Authorization"
            jwt_url_parameter: null
            roles_key: null
            subject_key: null
        authentication_backend:
          type: noop
      clientcert_auth_domain:
        description: "Authenticate via SSL client certificates"
        http_enabled: false
        transport_enabled: false
        order: 2
        http_authenticator:
          type: clientcert
          config:
            username_attribute: cn #optional, if omitted DN becomes username
          challenge: false
        authentication_backend:
          type: noop
      ldap:
        description: "Authenticate via LDAP or Active Directory"
        http_enabled: false
        transport_enabled: false
        order: 5
        http_authenticator:
          type: basic
          challenge: false
        authentication_backend:
          # LDAP authentication backend (authenticate users against a LDAP or Active Directory)
          type: ldap
          config:
            # enable ldaps
            enable_ssl: false
            # enable start tls, enable_ssl should be false
            enable_start_tls: false
            # send client certificate
            enable_ssl_client_auth: false
            # verify ldap hostname
            verify_hostnames: true
            hosts:
            - localhost:8389
            bind_dn: null
            password: null
            userbase: 'ou=people,dc=example,dc=com'
            # Filter to search for users (currently in the whole subtree beneath userbase)
            # {0} is substituted with the username
            usersearch: '(sAMAccountName={0})'
            # Use this attribute from the user as username (if not set then DN is used)
            username_attribute: null
      saml_auth_domain:
        order: 1
        description: "SAML provider"
        http_enabled: true
        transport_enabled: false
        http_authenticator:
          type: saml
          challenge: true
          config:
            idp:
              metadata_url: http://keycloak.enseva-labs.net:8080/auth/realms/elastic/protocol/saml/descriptor
              entity_id: http://keycloak.enseva-labs.net:8080/auth/realms/elastic
            sp:
              entity_id: elastic
              forceAuthn: true
            kibana_url: https://elastic-stack.enseva-labs.net:5601
            roles_key: Role
            exchange_key: 39b49528-eec3-4364-ad0d-1e091cfa4fe2
          authentication_backend:
          type: noop
    authz:
      roles_from_myldap:
        description: "Authorize via LDAP or Active Directory"
        http_enabled: false
        transport_enabled: false
        authorization_backend:
          # LDAP authorization backend (gather roles from a LDAP or Active Directory, you have to configure the above LDAP authentication backend settings too)
          type: ldap
          config:
            # enable ldaps
            enable_ssl: false
            # enable start tls, enable_ssl should be false
            enable_start_tls: false
            # send client certificate
            enable_ssl_client_auth: false
            # verify ldap hostname
            verify_hostnames: true
            hosts:
            - localhost:8389
            bind_dn: null
            password: null
            rolebase: 'ou=groups,dc=example,dc=com'
            # Filter to search for roles (currently in the whole subtree beneath rolebase)
            # {0} is substituted with the DN of the user
            # {1} is substituted with the username
            # {2} is substituted with an attribute value from user's directory entry, of the authenticated user. Use userroleattribute to specify the name of the attribute
            rolesearch: '(member={0})'
            # Specify the name of the attribute which value should be substituted with {2} above
            userroleattribute: null
            # Roles as an attribute of the user entry
            userrolename: disabled
            #userrolename: memberOf
            # The attribute in a role entry containing the name of that role, Default is "name".
            # Can also be "dn" to use the full DN as rolename.
            rolename: cn
            # Resolve nested roles transitive (roles which are members of other roles and so on ...)
            resolve_nested_roles: true
            userbase: 'ou=people,dc=example,dc=com'
            # Filter to search for users (currently in the whole subtree beneath userbase)
            # {0} is substituted with the username
            usersearch: '(uid={0})'
            # Skip users matching a user name, a wildcard or a regex pattern
            #skip_users:
            #  - 'cn=Michael Jackson,ou*people,o=TEST'
            #  - '/\S*/'
      roles_from_another_ldap:
        description: "Authorize via another Active Directory"
        http_enabled: false
        transport_enabled: false
        authorization_backend:
          type: ldap
          #config goes here ...
  #    auth_failure_listeners:
  #      ip_rate_limiting:
  #        type: ip
  #        allowed_tries: 10
  #        time_window_seconds: 3600
  #        block_expiry_seconds: 600
  #        max_blocked_clients: 100000
  #        max_tracked_clients: 100000
  #      internal_authentication_backend_limiting:
  #        type: username
  #        authentication_backend: intern
  #        allowed_tries: 10
  #        time_window_seconds: 3600
  #        block_expiry_seconds: 600
  #        max_blocked_clients: 100000
  #        max_tracked_clients: 100000

I execute securityadmin.sh

Enabled SAML in Kibana

kibana.yml
root@elastic-stack:/etc/kibana# grep -v "^#\|^$" kibana.yml
server.host: "10.200.6.21"
server.port: 5601
server.name: "elastic-stack.enseva-labs.net"
server.ssl.enabled: true
server.ssl.key: "/etc/kibana/admin-key.pem"
server.ssl.certificate: "/etc/kibana/admin.pem"
elasticsearch.hosts: "https://elastic-stack.enseva-labs.net:9200"
elasticsearch.username: kibanaserver
elasticsearch.password: kibanaserver
elasticsearch.requestHeadersWhitelist: ["securitytenant","Authorization"]
elasticsearch.ssl.certificateAuthorities: "/etc/kibana/root-ca.pem"
elasticsearch.ssl.verificationMode: none
opendistro_security.multitenancy.enabled: true
opendistro_security.multitenancy.tenants.preferred: ["Private", "Global"]
opendistro_security.readonly_mode.roles: ["kibana_read_only"]
opendistro_security.auth.type: "saml"
server.xsrf.whitelist: ["/_opendistro/_security/saml/acs/idpinitiated", "/_opendistro/_security/saml/acs", "/_opendistro/_security/saml/logout"]
opendistro_security.cookie.secure: false
newsfeed.enabled: false
telemetry.optIn: false
telemetry.enabled: false
security.showInsecureClusterWarning: false
map.includeElasticMapsService: false
logging.dest: '/etc/kibana/kibana.log'
root@elastic-stack:/etc/kibana#

Restarted kibana service

Minute later I check the status again and seen this.

Below are the logs.

{"type":"log","@timestamp":"2021-07-21T01:35:54Z","tags":["info","plugins-system"],"pid":3460,"message":"Stopping all plugins."}
{"type":"log","@timestamp":"2021-07-21T01:36:00Z","tags":["info","plugins-service"],"pid":3863,"message":"Plugin \"telemetryManagementSection\" has been disabled since the following direct or transitive dependencies are missing or disabled: [telemetry]"}
{"type":"log","@timestamp":"2021-07-21T01:36:00Z","tags":["info","plugins-service"],"pid":3863,"message":"Plugin \"newsfeed\" is disabled."}
{"type":"log","@timestamp":"2021-07-21T01:36:00Z","tags":["info","plugins-service"],"pid":3863,"message":"Plugin \"telemetry\" is disabled."}
{"type":"log","@timestamp":"2021-07-21T01:36:00Z","tags":["info","plugins-service"],"pid":3863,"message":"Plugin \"visTypeXy\" is disabled."}
{"type":"log","@timestamp":"2021-07-21T01:36:00Z","tags":["warning","config","deprecation"],"pid":3863,"message":"It is not recommended to disable xsrf protections for API endpoints via [server.xsrf.whitelist]. It will be removed in 8.0 release. Instead, supply the \"kbn-xsrf\" header."}
{"type":"log","@timestamp":"2021-07-21T01:36:01Z","tags":["info","plugins-system"],"pid":3863,"message":"Setting up [47] plugins: [opendistroAlertingKibana,usageCollection,telemetryCollectionManager,kibanaUsageCollection,securityOss,mapsLegacy,kibanaLegacy,share,legacyExport,embeddable,expressions,data,home,console,apmOss,management,indexPatternManagement,advancedSettings,savedObjects,opendistroSecurityKibana,opendistroIndexManagementKibana,opendistroAnomalyDetectionKibana,dashboard,opendistroNotebooksKibana,visualizations,visTypeVega,visTypeTimelion,timelion,visTypeMarkdown,visTypeTable,tileMap,regionMap,inputControlVis,opendistroGanttChartKibana,visualize,opendistroTraceAnalyticsKibana,opendistroReportsKibana,opendistroQueryWorkbenchKibana,esUiShared,charts,visTypeVislib,visTypeTimeseries,visTypeTagcloud,visTypeMetric,discover,savedObjectsManagement,bfetch]"}
{"type":"log","@timestamp":"2021-07-21T01:36:01Z","tags":["info","savedobjects-service"],"pid":3863,"message":"Waiting until all Elasticsearch nodes are compatible with Kibana before starting saved objects migrations..."}
{"type":"log","@timestamp":"2021-07-21T01:36:01Z","tags":["info","savedobjects-service"],"pid":3863,"message":"Starting saved objects migrations"}
{"type":"log","@timestamp":"2021-07-21T01:36:01Z","tags":["info","plugins-system"],"pid":3863,"message":"Starting [47] plugins: [opendistroAlertingKibana,usageCollection,telemetryCollectionManager,kibanaUsageCollection,securityOss,mapsLegacy,kibanaLegacy,share,legacyExport,embeddable,expressions,data,home,console,apmOss,management,indexPatternManagement,advancedSettings,savedObjects,opendistroSecurityKibana,opendistroIndexManagementKibana,opendistroAnomalyDetectionKibana,dashboard,opendistroNotebooksKibana,visualizations,visTypeVega,visTypeTimelion,timelion,visTypeMarkdown,visTypeTable,tileMap,regionMap,inputControlVis,opendistroGanttChartKibana,visualize,opendistroTraceAnalyticsKibana,opendistroReportsKibana,opendistroQueryWorkbenchKibana,esUiShared,charts,visTypeVislib,visTypeTimeseries,visTypeTagcloud,visTypeMetric,discover,savedObjectsManagement,bfetch]"}
{"type":"log","@timestamp":"2021-07-21T01:36:02Z","tags":["listening","info"],"pid":3863,"message":"Server running at https://10.200.6.21:5601"}
been{"type":"log","@timestamp":"2021-07-21T01:36:02Z","tags":["info","http","server","Kibana"],"pid":3863,"message":"http server running at https://10.200.6.21:5601"}

journal
Jul 20 20:43:01 elastic-stack.enseva-labs.net performance-analyzer-agent-cli[2850]: Jul 20, 2021 8:43:01 PM org.jooq.tools.JooqLogger info
Jul 20 20:43:01 elastic-stack.enseva-labs.net performance-analyzer-agent-cli[2850]: INFO: Single batch             : No bind variables have been provided with a single statement batch execution. This may be due to accidental API misuse
Jul 20 20:43:04 elastic-stack.enseva-labs.net performance-analyzer-agent-cli[2850]: 20:43:04.147 [nN9RaSpDT76lwugD4rah1Q-task-0-] ERROR com.amazon.opendistro.elasticsearch.performanceanalyzer.rca.framework.api.persist.SQLParsingUtil - Ed
Jul 20 20:43:04 elastic-stack.enseva-labs.net performance-analyzer-agent-cli[2850]: 20:43:04.147 [nN9RaSpDT76lwugD4rah1Q-task-0-] ERROR com.amazon.opendistro.elasticsearch.performanceanalyzer.rca.framework.api.persist.SQLParsingUtil - Su
Jul 20 20:43:04 elastic-stack.enseva-labs.net performance-analyzer-agent-cli[2850]: 20:43:04.148 [nN9RaSpDT76lwugD4rah1Q-task-0-] ERROR com.amazon.opendistro.elasticsearch.performanceanalyzer.rca.store.collector.NodeConfigCollector - Met
Jul 20 20:43:04 elastic-stack.enseva-labs.net performance-analyzer-agent-cli[2850]: metric_enum: HEAP_MAX

Elasticsearch

elasticsearch_status
root@elastic-stack:/etc/kibana# curl -XGET https://elastic-stack.enseva-labs.net:9200/_cluster/health?pretty=true  -u 'admin:admin' --insecure
{
  "cluster_name" : "elasticsearch",
  "status" : "yellow",
  "timed_out" : false,
  "number_of_nodes" : 1,
  "number_of_data_nodes" : 1,
  "active_primary_shards" : 27,
  "active_shards" : 27,
  "relocating_shards" : 0,
  "initializing_shards" : 0,
  "unassigned_shards" : 22,
  "delayed_unassigned_shards" : 0,
  "number_of_pending_tasks" : 0,
  "number_of_in_flight_fetch" : 0,
  "task_max_waiting_in_queue_millis" : 0,
  "active_shards_percent_as_number" : 55.10204081632652
}
root@elastic-stack:/etc/kibana# curl -XGET https://elastic-stack.enseva-labs.net:9200/_cat/shards   -u 'admin:admin' --insecure
winlogbeat-7.10.2-2021.07.19     0 p STARTED      5115   2.3mb 10.200.6.21 elastic-stack.enseva-labs.net
winlogbeat-7.10.2-2021.07.19     0 r UNASSIGNED
metricbeat-7.10.2-2021.07.16     0 p STARTED     36368   7.2mb 10.200.6.21 elastic-stack.enseva-labs.net
metricbeat-7.10.2-2021.07.16     0 r UNASSIGNED
metricbeat-7.10.2-2021.07.20     0 p STARTED    124106  25.5mb 10.200.6.21 elastic-stack.enseva-labs.net
metricbeat-7.10.2-2021.07.20     0 r UNASSIGNED
.kibana_92668751_admin_1         0 p STARTED       703 388.6kb 10.200.6.21 elastic-stack.enseva-labs.net
metricbeat-7.10.0-2021.07.17     0 p STARTED    492764  87.7mb 10.200.6.21 elastic-stack.enseva-labs.net
metricbeat-7.10.0-2021.07.17     0 r UNASSIGNED
.opendistro_security             0 p STARTED         9    82kb 10.200.6.21 elastic-stack.enseva-labs.net
.kibana_-1666338091_elastic_1    0 p STARTED         1     5kb 10.200.6.21 elastic-stack.enseva-labs.net
metricbeat-7.10.2-2021.07.19     0 p STARTED    142521  26.9mb 10.200.6.21 elastic-stack.enseva-labs.net
metricbeat-7.10.2-2021.07.19     0 r UNASSIGNED
.kibana_1                        0 p STARTED        40  58.2kb 10.200.6.21 elastic-stack.enseva-labs.net
security-auditlog-2021.07.19     0 p STARTED        17 172.3kb 10.200.6.21 elastic-stack.enseva-labs.net
security-auditlog-2021.07.19     0 r UNASSIGNED
metricbeat-7.10.2-2021.07.18     0 p STARTED    142333    27mb 10.200.6.21 elastic-stack.enseva-labs.net
metricbeat-7.10.2-2021.07.18     0 r UNASSIGNED
winlogbeat-7.10.2-2021.07.20     0 p STARTED      7057   3.1mb 10.200.6.21 elastic-stack.enseva-labs.net
winlogbeat-7.10.2-2021.07.20     0 r UNASSIGNED
metricbeat-7.10.0-2021.07.19     0 p STARTED    492763  87.8mb 10.200.6.21 elastic-stack.enseva-labs.net
metricbeat-7.10.0-2021.07.19     0 r UNASSIGNED
security-auditlog-2021.07.17     0 p STARTED      3390 645.7kb 10.200.6.21 elastic-stack.enseva-labs.net
security-auditlog-2021.07.17     0 r UNASSIGNED
.kibana_-152937574_admintenant_1 0 p STARTED         1     5kb 10.200.6.21 elastic-stack.enseva-labs.net
winlogbeat-7.10.2-2021.07.21     0 p STARTED       403 748.9kb 10.200.6.21 elastic-stack.enseva-labs.net
winlogbeat-7.10.2-2021.07.21     0 r UNASSIGNED
security-auditlog-2021.07.21     0 p STARTED       153 203.2kb 10.200.6.21 elastic-stack.enseva-labs.net
security-auditlog-2021.07.21     0 r UNASSIGNED
metricbeat-7.10.0-2021.07.16     0 p STARTED    115694  21.6mb 10.200.6.21 elastic-stack.enseva-labs.net
metricbeat-7.10.0-2021.07.16     0 r UNASSIGNED
security-auditlog-2021.07.16     0 p STARTED        75 230.2kb 10.200.6.21 elastic-stack.enseva-labs.net
security-auditlog-2021.07.16     0 r UNASSIGNED
metricbeat-7.10.0-2021.07.18     0 p STARTED    492782  87.8mb 10.200.6.21 elastic-stack.enseva-labs.net
metricbeat-7.10.0-2021.07.18     0 r UNASSIGNED
metricbeat-7.10.0-2021.07.20     0 p STARTED    427715  79.5mb 10.200.6.21 elastic-stack.enseva-labs.net
metricbeat-7.10.0-2021.07.20     0 r UNASSIGNED
winlogbeat-7.10.2-2021.07.18     0 p STARTED      5136   2.3mb 10.200.6.21 elastic-stack.enseva-labs.net
winlogbeat-7.10.2-2021.07.18     0 r UNASSIGNED
winlogbeat-7.10.2-2021.07.17     0 p STARTED      5172   2.3mb 10.200.6.21 elastic-stack.enseva-labs.net
winlogbeat-7.10.2-2021.07.17     0 r UNASSIGNED
security-auditlog-2021.07.20     0 p STARTED       766   384kb 10.200.6.21 elastic-stack.enseva-labs.net
security-auditlog-2021.07.20     0 r UNASSIGNED
metricbeat-7.10.2-2021.07.17     0 p STARTED    142344  26.7mb 10.200.6.21 elastic-stack.enseva-labs.net
metricbeat-7.10.2-2021.07.17     0 r UNASSIGNED
security-auditlog-2021.07.18     0 p STARTED        18 188.3kb 10.200.6.21 elastic-stack.enseva-labs.net
security-auditlog-2021.07.18     0 r UNASSIGNED
winlogbeat-7.10.2-2021.07.16     0 p STARTED      3621   1.5mb 10.200.6.21 elastic-stack.enseva-labs.net
winlogbeat-7.10.2-2021.07.16     0 r UNASSIGNED
root@elastic-stack:/etc/kibana#

This is what i get on the Web UI.

Still not sure whats going on. I have tested Elastic-Stack with keycloak and it work but unfortunately I need a license to enable it. I’m looking into the errors and warnings but not seeing a fix or confgiuration needed.

Any advice or suggests would be greatly apperciated.

Thank you in advance

EDIT: I did fix the errors from securityadmin.sh. The problem was indents in the yaml file under.

authentication_backend:
type: noop


No change in the errors , still working on it.

@Gsmitt
The first thing is the order on the config.yml, can you change the order for basic auth to ‘0’, this way it will try basic auth first and if failed will proceed to saml.

Once that is done and uploaded via securityadmin.sh script, can you navigate to the browser and try to connect, there should be saml response in elasticsearch logs, can you share this or any errors in the logs?

1 Like

Hello,

This is completed

config.yml
---
_meta:
  type: "config"
  config_version: 2
config:
  dynamic:
    # Set filtered_alias_mode to 'disallow' to forbid more than 2 filtered aliases per index
    # Set filtered_alias_mode to 'warn' to allow more than 2 filtered aliases per index but warns about it (default)
    # Set filtered_alias_mode to 'nowarn' to allow more than 2 filtered aliases per index silently
    #filtered_alias_mode: warn
    #do_not_fail_on_forbidden: false
    #kibana:
    # Kibana multitenancy
    #multitenancy_enabled: true
    #server_username: kibanaserver
    #index: '.kibana'
    http:
      anonymous_auth_enabled: false
      xff:
        enabled: false
        internalProxies: '192\.168\.0\.10|192\.168\.0\.11' # regex pattern
        #internalProxies: '.*' # trust all internal proxies, regex pattern
        #remoteIpHeader:  'x-forwarded-for'
        ###### see https://docs.oracle.com/javase/7/docs/api/java/util/regex/Pattern.html for regex help
        ###### more information about XFF https://en.wikipedia.org/wiki/X-Forwarded-For
        ###### and here https://tools.ietf.org/html/rfc7239
        ###### and https://tomcat.apache.org/tomcat-8.0-doc/config/valve.html#Remote_IP_Valve
    authc:
      kerberos_auth_domain:
        http_enabled: false
        transport_enabled: false
        order: 6
        http_authenticator:
          type: kerberos
          challenge: true
          config:
            # If true a lot of kerberos/security related debugging output will be logged to standard out
            krb_debug: false
            # If true then the realm will be stripped from the user name
            strip_realm_from_principal: true
        authentication_backend:
          type: noop
      basic_internal_auth_domain:
        description: "Authenticate via HTTP Basic against internal users database"
        http_enabled: true
        transport_enabled: true
        order: 0
        http_authenticator:
          type: basic
          challenge: false
        authentication_backend:
          type: intern
      proxy_auth_domain:
        description: "Authenticate via proxy"
        http_enabled: false
        transport_enabled: false
        order: 3
        http_authenticator:
          type: proxy
          challenge: false
          config:
            user_header: "x-proxy-user"
            roles_header: "x-proxy-roles"
        authentication_backend:
          type: noop
      jwt_auth_domain:
        description: "Authenticate via Json Web Token"
        http_enabled: false
        transport_enabled: false
        order: 0
        http_authenticator:
          type: jwt
          challenge: false
          config:
            signing_key: "base64 encoded HMAC key or public RSA/ECDSA pem key"
            jwt_header: "Authorization"
            jwt_url_parameter: null
            roles_key: null
            subject_key: null
        authentication_backend:
          type: noop
      clientcert_auth_domain:
        description: "Authenticate via SSL client certificates"
        http_enabled: false
        transport_enabled: false
        order: 2
        http_authenticator:
          type: clientcert
          config:
            username_attribute: cn #optional, if omitted DN becomes username
          challenge: false
        authentication_backend:
          type: noop
      ldap:
        description: "Authenticate via LDAP or Active Directory"
        http_enabled: false
        transport_enabled: false
        order: 5
        http_authenticator:
          type: basic
          challenge: false
        authentication_backend:
          # LDAP authentication backend (authenticate users against a LDAP or Active Directory)
          type: ldap
          config:
            # enable ldaps
            enable_ssl: false
            # enable start tls, enable_ssl should be false
            enable_start_tls: false
            # send client certificate
            enable_ssl_client_auth: false
            # verify ldap hostname
            verify_hostnames: true
            hosts:
            - localhost:8389
            bind_dn: null
            password: null
            userbase: 'ou=people,dc=example,dc=com'
            # Filter to search for users (currently in the whole subtree beneath userbase)
            # {0} is substituted with the username
            usersearch: '(sAMAccountName={0})'
            # Use this attribute from the user as username (if not set then DN is used)
            username_attribute: null
      saml_auth_domain:
        order: 1
        description: "SAML provider"
        http_enabled: true
        transport_enabled: false
        http_authenticator:
          type: saml
          challenge: true
          config:
            idp:
              metadata_url: http://keycloak.enseva-labs.net:8080/auth/realms/elastic/protocol/saml/descriptor
              entity_id: http://keycloak.enseva-labs.net:8080/auth/realms/elastic/
            sp:
              entity_id: elastic
              forceAuthn: true
            kibana_url: https://elastic-stack.enseva-labs.net:5601/
            roles_key: Role
            exchange_key: 39b49528-eec3-4364-ad0d-1e091cfa4fe2
        authentication_backend:
          type: noop
    authz:
      roles_from_myldap:
        description: "Authorize via LDAP or Active Directory"
        http_enabled: false
        transport_enabled: false
        authorization_backend:
          # LDAP authorization backend (gather roles from a LDAP or Active Directory, you have to configure the above LDAP authentication backend settings too)
          type: ldap
          config:
            # enable ldaps
            enable_ssl: false
            # enable start tls, enable_ssl should be false
            enable_start_tls: false
            # send client certificate
            enable_ssl_client_auth: false
            # verify ldap hostname
            verify_hostnames: true
            hosts:
            - localhost:8389
            bind_dn: null
            password: null
            rolebase: 'ou=groups,dc=example,dc=com'
            # Filter to search for roles (currently in the whole subtree beneath rolebase)
            # {0} is substituted with the DN of the user
            # {1} is substituted with the username
            # {2} is substituted with an attribute value from user's directory entry, of the authenticated user. Use userroleattribute to specify the name of the attribute
            rolesearch: '(member={0})'
            # Specify the name of the attribute which value should be substituted with {2} above
            userroleattribute: null
            # Roles as an attribute of the user entry
            userrolename: disabled
            #userrolename: memberOf
            # The attribute in a role entry containing the name of that role, Default is "name".
            # Can also be "dn" to use the full DN as rolename.
            rolename: cn
            # Resolve nested roles transitive (roles which are members of other roles and so on ...)
            resolve_nested_roles: true
            userbase: 'ou=people,dc=example,dc=com'
            # Filter to search for users (currently in the whole subtree beneath userbase)
            # {0} is substituted with the username
            usersearch: '(uid={0})'
            # Skip users matching a user name, a wildcard or a regex pattern
            #skip_users:
            #  - 'cn=Michael Jackson,ou*people,o=TEST'
            #  - '/\S*/'
      roles_from_another_ldap:
        description: "Authorize via another Active Directory"
        http_enabled: false
        transport_enabled: false
        authorization_backend:
          type: ldap
          #config goes here ...
  #    auth_failure_listeners:
  #      ip_rate_limiting:
  #        type: ip
  #        allowed_tries: 10
  #        time_window_seconds: 3600
  #        block_expiry_seconds: 600
  #        max_blocked_clients: 100000
  #        max_tracked_clients: 100000
  #      internal_authentication_backend_limiting:
  #        type: username
  #        authentication_backend: intern
  #        allowed_tries: 10
  #        time_window_seconds: 3600
  #        block_expiry_seconds: 600
  #        max_blocked_clients: 100000
  #        max_tracked_clients: 100000
root@elastic-stack:/usr/share/elasticsearch/plugins/opendistro_security/securityconfig#
./securityadmin.sh -h elastic-stack.enseva-labs.net  -cd ../securityconfig/ -icl -nhnv -cacert /etc/elasticsearch/root-ca.pem -cert /etc/elasticsearch/admin.pem -key /etc/elasticsearch/admin-key.pem -t config

I do get a redirect from ELK server to keycloak then I applied credentials.
I receive this.

In keycloak it shows my user “elastic” logged in.

Here Is some of the elasticsearch log files.

elasticsearch.log
[2021-07-21T16:58:44,739][INFO ][o.o.s.m.r.i.AbstractReloadingMetadataResolver] [elastic-stack.enseva-labs.net] Metadata Resolver SamlHTTPMetadataResolver com.amazon.dlic.auth.http.saml.HTTPSamlAuthenticator_6: New metadata successfully loaded for 'http://keycloak.enseva-labs.net:8080/auth/realms/elastic/protocol/saml/descriptor'
[2021-07-21T16:58:44,740][INFO ][o.o.s.m.r.i.AbstractReloadingMetadataResolver] [elastic-stack.enseva-labs.net] Metadata Resolver SamlHTTPMetadataResolver com.amazon.dlic.auth.http.saml.HTTPSamlAuthenticator_6: Next refresh cycle for metadata provider 'http://keycloak.enseva-labs.net:8080/auth/realms/elastic/protocol/saml/descriptor' will occur on '2021-07-22T00:58:44.730Z' ('2021-07-21T19:58:44.730-05:00' local time)
[2021-07-21T16:58:44,756][INFO ][c.a.o.s.a.i.AuditLogImpl ] [elastic-stack.enseva-labs.net] Auditing on REST API is enabled.
[2021-07-21T16:58:44,756][INFO ][c.a.o.s.a.i.AuditLogImpl ] [elastic-stack.enseva-labs.net] [AUTHENTICATED, GRANTED_PRIVILEGES] are excluded from REST API auditing.
[2021-07-21T16:58:44,756][INFO ][c.a.o.s.a.i.AuditLogImpl ] [elastic-stack.enseva-labs.net] Auditing on Transport API is enabled.
[2021-07-21T16:58:44,757][INFO ][c.a.o.s.a.i.AuditLogImpl ] [elastic-stack.enseva-labs.net] [AUTHENTICATED, GRANTED_PRIVILEGES] are excluded from Transport API auditing.
[2021-07-21T16:58:44,757][INFO ][c.a.o.s.a.i.AuditLogImpl ] [elastic-stack.enseva-labs.net] Auditing of request body is enabled.
[2021-07-21T16:58:44,757][INFO ][c.a.o.s.a.i.AuditLogImpl ] [elastic-stack.enseva-labs.net] Bulk requests resolution is disabled during request auditing.
[2021-07-21T16:58:44,757][INFO ][c.a.o.s.a.i.AuditLogImpl ] [elastic-stack.enseva-labs.net] Index resolution is enabled during request auditing.
[2021-07-21T16:58:44,757][INFO ][c.a.o.s.a.i.AuditLogImpl ] [elastic-stack.enseva-labs.net] Sensitive headers auditing is enabled.
[2021-07-21T16:58:44,757][INFO ][c.a.o.s.a.i.AuditLogImpl ] [elastic-stack.enseva-labs.net] Auditing requests from kibanaserver users is disabled.
[2021-07-21T16:58:44,757][INFO ][c.a.o.s.a.i.AuditLogImpl ] [elastic-stack.enseva-labs.net] Auditing of external configuration is disabled.
[2021-07-21T16:58:44,758][INFO ][c.a.o.s.a.i.AuditLogImpl ] [elastic-stack.enseva-labs.net] Auditing of internal configuration is enabled.
[2021-07-21T16:58:44,758][INFO ][c.a.o.s.a.i.AuditLogImpl ] [elastic-stack.enseva-labs.net] Auditing only metadata information for read request is enabled.
[2021-07-21T16:58:44,758][INFO ][c.a.o.s.a.i.AuditLogImpl ] [elastic-stack.enseva-labs.net] Auditing will watch {} for read requests.
[2021-07-21T16:58:44,758][INFO ][c.a.o.s.a.i.AuditLogImpl ] [elastic-stack.enseva-labs.net] Auditing read operation requests from kibanaserver users is disabled.
[2021-07-21T16:58:44,758][INFO ][c.a.o.s.a.i.AuditLogImpl ] [elastic-stack.enseva-labs.net] Auditing only metadata information for write request is enabled.
[2021-07-21T16:58:44,758][INFO ][c.a.o.s.a.i.AuditLogImpl ] [elastic-stack.enseva-labs.net] Auditing diffs for write requests is disabled.
[2021-07-21T16:58:44,759][INFO ][c.a.o.s.a.i.AuditLogImpl ] [elastic-stack.enseva-labs.net] Auditing write operation requests from kibanaserver users is disabled.
[2021-07-21T16:58:44,759][INFO ][c.a.o.s.a.i.AuditLogImpl ] [elastic-stack.enseva-labs.net] Auditing will watch <NONE> for write requests.
[2021-07-21T16:58:44,759][INFO ][c.a.o.s.a.i.AuditLogImpl ] [elastic-stack.enseva-labs.net] .opendistro_security is used as internal security index.
[2021-07-21T16:58:44,759][INFO ][c.a.o.s.a.i.AuditLogImpl ] [elastic-stack.enseva-labs.net] Internal index used for posting audit logs is null
[2021-07-21T16:59:19,081][INFO ][stats_log                ] [elastic-stack.enseva-labs.net] ------------------------------------------------------------------------
Program=PerformanceAnalyzerPlugin
rca-version=0.0.1
StartTime=1626904699.075
EndTime=Wed, 21 Jul 2021 16:59:19 CDT
Time=60006 msecs
Timing=total-time:60006.0/1
Counters=TotalError=0
EOE

2021-07-21T17:01:10,582][WARN ][c.a.d.a.h.s.AuthTokenProcessorHandler] [elastic-stack.enseva-labs.net] Error while validating SAML response
com.onelogin.saml2.exception.ValidationError: Found an Attribute element with duplicated Name
        at com.onelogin.saml2.authn.SamlResponse.getAttributes(SamlResponse.java:557) ~[java-saml-core-2.5.0.jar:?]
        at com.amazon.dlic.auth.http.saml.AuthTokenProcessorHandler.extractRoles(AuthTokenProcessorHandler.java:406) ~[opendistro_security-1.13.1.0.jar:1.13.1.0]
        at com.amazon.dlic.auth.http.saml.AuthTokenProcessorHandler.createJwt(AuthTokenProcessorHandler.java:313) ~[opendistro_security-1.13.1.0.jar:1.13.1.0]
        at com.amazon.dlic.auth.http.saml.AuthTokenProcessorHandler.handleImpl(AuthTokenProcessorHandler.java:175) [opendistro_security-1.13.1.0.jar:1.13.1.0]
        at com.amazon.dlic.auth.http.saml.AuthTokenProcessorHandler.handleLowLevel(AuthTokenProcessorHandler.java:232) [opendistro_security-1.13.1.0.jar:1.13.1.0]
        at com.amazon.dlic.auth.http.saml.AuthTokenProcessorHandler.access$000(AuthTokenProcessorHandler.java:70) [opendistro_security-1.13.1.0.jar:1.13.1.0]
        at com.amazon.dlic.auth.http.saml.AuthTokenProcessorHandler$1.run(AuthTokenProcessorHandler.java:136) [opendistro_security-1.13.1.0.jar:1.13.1.0]
        at com.amazon.dlic.auth.http.saml.AuthTokenProcessorHandler$1.run(AuthTokenProcessorHandler.java:132) [opendistro_security-1.13.1.0.jar:1.13.1.0]
        at java.security.AccessController.doPrivileged(AccessController.java:554) [?:?]
        at com.amazon.dlic.auth.http.saml.AuthTokenProcessorHandler.handle(AuthTokenProcessorHandler.java:132) [opendistro_security-1.13.1.0.jar:1.13.1.0]
        at com.amazon.dlic.auth.http.saml.HTTPSamlAuthenticator.reRequestAuthentication(HTTPSamlAuthenticator.java:168) [opendistro_security-1.13.1.0.jar:1.13.1.0]
        at com.amazon.opendistroforelasticsearch.security.auth.BackendRegistry.authenticate(BackendRegistry.java:445) [opendistro_security-1.13.1.0.jar:1.13.1.0]
        at com.amazon.opendistroforelasticsearch.security.filter.OpenDistroSecurityRestFilter.checkAndAuthenticateRequest(OpenDistroSecurityRestFilter.java:177) [opendistro_security-1.13.1.0.jar:1.13.1.0]
        at com.amazon.opendistroforelasticsearch.security.filter.OpenDistroSecurityRestFilter.access$000(OpenDistroSecurityRestFilter.java:66) [opendistro_security-1.13.1.0.jar:1.13.1.0]
        at com.amazon.opendistroforelasticsearch.security.filter.OpenDistroSecurityRestFilter$1.handleRequest(OpenDistroSecurityRestFilter.java:113) [opendistro_security-1.13.1.0.jar:1.13.1.0]
        at org.elasticsearch.rest.RestController.dispatchRequest(RestController.java:258) [elasticsearch-7.10.2.jar:7.10.2]
        at org.elasticsearch.rest.RestController.tryAllHandlers(RestController.java:340) [elasticsearch-7.10.2.jar:7.10.2]
        at org.elasticsearch.rest.RestController.dispatchRequest(RestController.java:191) [elasticsearch-7.10.2.jar:7.10.2]
        at com.amazon.opendistroforelasticsearch.security.ssl.http.netty.ValidatingDispatcher.dispatchRequest(ValidatingDispatcher.java:63) [opendistro_security-1.13.1.0.jar:1.13.1.0]
        at org.elasticsearch.http.AbstractHttpServerTransport.dispatchRequest(AbstractHttpServerTransport.java:319) [elasticsearch-7.10.2.jar:7.10.2]
        at org.elasticsearch.http.AbstractHttpServerTransport.handleIncomingRequest(AbstractHttpServerTransport.java:384) [elasticsearch-7.10.2.jar:7.10.2]
        at org.elasticsearch.http.AbstractHttpServerTransport.incomingRequest(AbstractHttpServerTransport.java:309) [elasticsearch-7.10.2.jar:7.10.2]
        at org.elasticsearch.http.netty4.Netty4HttpRequestHandler.channelRead0(Netty4HttpRequestHandler.java:42) [transport-netty4-client-7.10.2.jar:7.10.2]
        at org.elasticsearch.http.netty4.Netty4HttpRequestHandler.channelRead0(Netty4HttpRequestHandler.java:28) [transport-netty4-client-7.10.2.jar:7.10.2]
        at io.netty.channel.SimpleChannelInboundHandler.channelRead(SimpleChannelInboundHandler.java:99) [netty-transport-4.1.49.Final.jar:4.1.49.Final]
        at io.netty.channel.AbstractChannelHandlerContext.invokeChannelRead(AbstractChannelHandlerContext.java:379) [netty-transport-4.1.49.Final.jar:4.1.49.Final]
        at io.netty.channel.AbstractChannelHandlerContext.invokeChannelRead(AbstractChannelHandlerContext.java:365) [netty-transport-4.1.49.Final.jar:4.1.49.Final]
        at io.netty.channel.AbstractChannelHandlerContext.fireChannelRead(AbstractChannelHandlerContext.java:357) [netty-transport-4.1.49.Final.jar:4.1.49.Final]
        at org.elasticsearch.http.netty4.Netty4HttpPipeliningHandler.channelRead(Netty4HttpPipeliningHandler.java:58) [transport-netty4-client-7.10.2.jar:7.10.2]
        at io.netty.channel.AbstractChannelHandlerContext.invokeChannelRead(AbstractChannelHandlerContext.java:379) [netty-transport-4.1.49.Final.jar:4.1.49.Final]
        at io.netty.channel.AbstractChannelHandlerContext.invokeChannelRead(AbstractChannelHandlerContext.java:365) [netty-transport-4.1.49.Final.jar:4.1.49.Final]
        at io.netty.channel.AbstractChannelHandlerContext.fireChannelRead(AbstractChannelHandlerContext.java:357) [netty-transport-4.1.49.Final.jar:4.1.49.Final]
        at io.netty.handler.codec.MessageToMessageDecoder.channelRead(MessageToMessageDecoder.java:103) [netty-codec-4.1.49.Final.jar:4.1.49.Final]
        at io.netty.channel.AbstractChannelHandlerContext.invokeChannelRead(AbstractChannelHandlerContext.java:379) [netty-transport-4.1.49.Final.jar:4.1.49.Final]
        at io.netty.channel.AbstractChannelHandlerContext.invokeChannelRead(AbstractChannelHandlerContext.java:365) [netty-transport-4.1.49.Final.jar:4.1.49.Final]
        at io.netty.channel.AbstractChannelHandlerContext.fireChannelRead(AbstractChannelHandlerContext.java:357) [netty-transport-4.1.49.Final.jar:4.1.49.Final]
        at io.netty.handler.codec.ByteToMessageDecoder.fireChannelRead(ByteToMessageDecoder.java:324) [netty-codec-4.1.49.Final.jar:4.1.49.Final]
        at io.netty.handler.codec.ByteToMessageDecoder.channelRead(ByteToMessageDecoder.java:296) [netty-codec-4.1.49.Final.jar:4.1.49.Final]
        at io.netty.channel.AbstractChannelHandlerContext.invokeChannelRead(AbstractChannelHandlerContext.java:379) [netty-transport-4.1.49.Final.jar:4.1.49.Final]
        at io.netty.channel.AbstractChannelHandlerContext.invokeChannelRead(AbstractChannelHandlerContext.java:365) [netty-transport-4.1.49.Final.jar:4.1.49.Final]
        at io.netty.channel.AbstractChannelHandlerContext.fireChannelRead(AbstractChannelHandlerContext.java:357) [netty-transport-4.1.49.Final.jar:4.1.49.Final]
        at io.netty.handler.timeout.IdleStateHandler.channelRead(IdleStateHandler.java:286) [netty-handler-4.1.49.Final.jar:4.1.49.Final]
        at io.netty.channel.AbstractChannelHandlerContext.invokeChannelRead(AbstractChannelHandlerContext.java:379) [netty-transport-4.1.49.Final.jar:4.1.49.Final]
        at io.netty.channel.AbstractChannelHandlerContext.invokeChannelRead(AbstractChannelHandlerContext.java:365) [netty-transport-4.1.49.Final.jar:4.1.49.Final]
        at io.netty.channel.AbstractChannelHandlerContext.fireChannelRead(AbstractChannelHandlerContext.java:357) [netty-transport-4.1.49.Final.jar:4.1.49.Final]
        at io.netty.handler.codec.MessageToMessageDecoder.channelRead(MessageToMessageDecoder.java:103) [netty-codec-4.1.49.Final.jar:4.1.49.Final]
        at io.netty.channel.AbstractChannelHandlerContext.invokeChannelRead(AbstractChannelHandlerContext.java:379) [netty-transport-4.1.49.Final.jar:4.1.49.Final]
        at io.netty.channel.AbstractChannelHandlerContext.invokeChannelRead(AbstractChannelHandlerContext.java:365) [netty-transport-4.1.49.Final.jar:4.1.49.Final]
        at io.netty.channel.AbstractChannelHandlerContext.fireChannelRead(AbstractChannelHandlerContext.java:357) [netty-transport-4.1.49.Final.jar:4.1.49.Final]
        at io.netty.handler.ssl.SslHandler.unwrap(SslHandler.java:1518) [netty-handler-4.1.49.Final.jar:4.1.49.Final]
        at io.netty.handler.ssl.SslHandler.decodeJdkCompatible(SslHandler.java:1267) [netty-handler-4.1.49.Final.jar:4.1.49.Final]
        at io.netty.handler.ssl.SslHandler.decode(SslHandler.java:1314) [netty-handler-4.1.49.Final.jar:4.1.49.Final]
        at io.netty.handler.codec.ByteToMessageDecoder.decodeRemovalReentryProtection(ByteToMessageDecoder.java:501) [netty-codec-4.1.49.Final.jar:4.1.49.Final]
        at io.netty.handler.codec.ByteToMessageDecoder.callDecode(ByteToMessageDecoder.java:440) [netty-codec-4.1.49.Final.jar:4.1.49.Final]
        at io.netty.handler.codec.ByteToMessageDecoder.channelRead(ByteToMessageDecoder.java:276) [netty-codec-4.1.49.Final.jar:4.1.49.Final]
        at io.netty.channel.AbstractChannelHandlerContext.invokeChannelRead(AbstractChannelHandlerContext.java:379) [netty-transport-4.1.49.Final.jar:4.1.49.Final]
        at io.netty.channel.AbstractChannelHandlerContext.invokeChannelRead(AbstractChannelHandlerContext.java:365) [netty-transport-4.1.49.Final.jar:4.1.49.Final]
        at io.netty.channel.AbstractChannelHandlerContext.fireChannelRead(AbstractChannelHandlerContext.java:357) [netty-transport-4.1.49.Final.jar:4.1.49.Final]
        at io.netty.channel.DefaultChannelPipeline$HeadContext.channelRead(DefaultChannelPipeline.java:1410) [netty-transport-4.1.49.Final.jar:4.1.49.Final]
        at io.netty.channel.AbstractChannelHandlerContext.invokeChannelRead(AbstractChannelHandlerContext.java:379) [netty-transport-4.1.49.Final.jar:4.1.49.Final]
        at io.netty.channel.AbstractChannelHandlerContext.invokeChannelRead(AbstractChannelHandlerContext.java:365) [netty-transport-4.1.49.Final.jar:4.1.49.Final]
        at io.netty.channel.DefaultChannelPipeline.fireChannelRead(DefaultChannelPipeline.java:919) [netty-transport-4.1.49.Final.jar:4.1.49.Final]
        at io.netty.channel.nio.AbstractNioByteChannel$NioByteUnsafe.read(AbstractNioByteChannel.java:163) [netty-transport-4.1.49.Final.jar:4.1.49.Final]
        at io.netty.channel.nio.NioEventLoop.processSelectedKey(NioEventLoop.java:714) [netty-transport-4.1.49.Final.jar:4.1.49.Final]
        at io.netty.channel.nio.NioEventLoop.processSelectedKeysPlain(NioEventLoop.java:615) [netty-transport-4.1.49.Final.jar:4.1.49.Final]
        at io.netty.channel.nio.NioEventLoop.processSelectedKeys(NioEventLoop.java:578) [netty-transport-4.1.49.Final.jar:4.1.49.Final]
        at io.netty.channel.nio.NioEventLoop.run(NioEventLoop.java:493) [netty-transport-4.1.49.Final.jar:4.1.49.Final]
        at io.netty.util.concurrent.SingleThreadEventExecutor$4.run(SingleThreadEventExecutor.java:989) [netty-common-4.1.49.Final.jar:4.1.49.Final]
        at io.netty.util.internal.ThreadExecutorMap$2.run(ThreadExecutorMap.java:74) [netty-common-4.1.49.Final.jar:4.1.49.Final]
        at java.lang.Thread.run(Thread.java:832) [?:?]

As for anything else in the log file I did not see anything that pertained to SAML.

Here is the logs from Kibana during the logon attempt.

kibana.log

{"type":"response","@timestamp":"2021-07-21T22:23:18Z","tags":[],"pid":8834,"method":"post","statusCode":400,"req":{"url":"/_opendistro/_security/saml/acs","method":"post","headers":{"host":"elastic-stack.enseva-labs.net:5601","connection":"keep-alive","content-length":"16027","cache-control":"max-age=0","sec-ch-ua":"\" Not;A Brand\";v=\"99\", \"Google Chrome\";v=\"91\", \"Chromium\";v=\"91\"","sec-ch-ua-mobile":"?0","upgrade-insecure-requests":"1","user-agent":"Mozilla/5.0 (Windows NT 10.0; Win64; x64) AppleWebKit/537.36 (KHTML, like Gecko) Chrome/91.0.4472.124 Safari/537.36","origin":"null","content-type":"application/x-www-form-urlencoded","accept":"text/html,application/xhtml+xml,application/xml;q=0.9,image/avif,image/webp,image/apng,*/*;q=0.8,application/signed-exchange;v=b3;q=0.9","sec-fetch-site":"cross-site","sec-fetch-mode":"navigate","sec-fetch-user":"?1","sec-fetch-dest":"document","accept-encoding":"gzip, deflate, br","accept-language":"en-US,en;q=0.9"},"remoteAddress":"10.200.6.67","userAgent":"Mozilla/5.0 (Windows NT 10.0; Win64; x64) AppleWebKit/537.36 (KHTML, like Gecko) Chrome/91.0.4472.124 Safari/537.36"},"res":{"statusCode":400,"responseTime":9,"contentLength":9},"message":"POST /_opendistro/_security/saml/acs 400 9ms - 9.0B"}
{"type":"error","@timestamp":"2021-07-21T22:23:36Z","tags":["connection","client","error"],"pid":8834,"level":"error","error":{"message":"140516781012800:error:14094416:SSL routines:ssl3_read_bytes:sslv3 alert certificate unknown:../deps/openssl/openssl/ssl/record/rec_layer_s3.c:1544:SSL alert number 46\n","name":"Error","stack":"Error: 140516781012800:error:14094416:SSL routines:ssl3_read_bytes:sslv3 alert certificate unknown:../deps/openssl/openssl/ssl/record/rec_layer_s3.c:1544:SSL alert number 46\n"},"message":"140516781012800:error:14094416:SSL routines:ssl3_read_bytes:sslv3 alert certificate unknown:../deps/openssl/openssl/ssl/record/rec_layer_s3.c:1544:SSL alert number 46\n"}
{"type":"response","@timestamp":"2021-07-21T22:23:43Z","tags":[],"pid":8834,"method":"get","statusCode":302,"req":{"url":"/","method":"get","headers":{"host":"elastic-stack.enseva-labs.net:5601","connection":"keep-alive","sec-ch-ua":"\" Not;A Brand\";v=\"99\", \"Google Chrome\";v=\"91\", \"Chromium\";v=\"91\"","sec-ch-ua-mobile":"?0","upgrade-insecure-requests":"1","user-agent":"Mozilla/5.0 (Windows NT 10.0; Win64; x64) AppleWebKit/537.36 (KHTML, like Gecko) Chrome/91.0.4472.124 Safari/537.36","accept":"text/html,application/xhtml+xml,application/xml;q=0.9,image/avif,image/webp,image/apng,*/*;q=0.8,application/signed-exchange;v=b3;q=0.9","sec-fetch-site":"none","sec-fetch-mode":"navigate","sec-fetch-user":"?1","sec-fetch-dest":"document","accept-encoding":"gzip, deflate, br","accept-language":"en-US,en;q=0.9"},"remoteAddress":"10.200.6.67","userAgent":"Mozilla/5.0 (Windows NT 10.0; Win64; x64) AppleWebKit/537.36 (KHTML, like Gecko) Chrome/91.0.4472.124 Safari/537.36"},"res":{"statusCode":302,"responseTime":5,"contentLength":9},"message":"GET / 302 5ms - 9.0B"}
{"type":"response","@timestamp":"2021-07-21T22:23:43Z","tags":[],"pid":8834,"method":"get","statusCode":302,"req":{"url":"/auth/saml/login?nextUrl=%2F","method":"get","headers":{"host":"elastic-stack.enseva-labs.net:5601","connection":"keep-alive","upgrade-insecure-requests":"1","user-agent":"Mozilla/5.0 (Windows NT 10.0; Win64; x64) AppleWebKit/537.36 (KHTML, like Gecko) Chrome/91.0.4472.124 Safari/537.36","accept":"text/html,application/xhtml+xml,application/xml;q=0.9,image/avif,image/webp,image/apng,*/*;q=0.8,application/signed-exchange;v=b3;q=0.9","sec-fetch-site":"none","sec-fetch-mode":"navigate","sec-fetch-user":"?1","sec-fetch-dest":"document","sec-ch-ua":"\" Not;A Brand\";v=\"99\", \"Google Chrome\";v=\"91\", \"Chromium\";v=\"91\"","sec-ch-ua-mobile":"?0","accept-encoding":"gzip, deflate, br","accept-language":"en-US,en;q=0.9"},"remoteAddress":"10.200.6.67","userAgent":"Mozilla/5.0 (Windows NT 10.0; Win64; x64) AppleWebKit/537.36 (KHTML, like Gecko) Chrome/91.0.4472.124 Safari/537.36"},"res":{"statusCode":302,"responseTime":14,"contentLength":9},"message":"GET /auth/saml/login?nextUrl=%2F 302 14ms - 9.0B"}
{"type":"log","@timestamp":"2021-07-21T22:23:50Z","tags":["error","plugins","opendistroSecurityKibana"],"pid":8834,"message":"SAML SP initiated authentication workflow failed: Error: failed to get token"}
{"type":"error","@timestamp":"2021-07-21T22:23:49Z","tags":[],"pid":8834,"level":"error","error":{"message":"Internal Server Error","name":"Error","stack":"Error: Internal Server Error\n    at HapiResponseAdapter.toError (/usr/share/kibana/src/core/server/http/router/response_adapter.js:132:19)\n    at HapiResponseAdapter.toHapiResponse (/usr/share/kibana/src/core/server/http/router/response_adapter.js:86:19)\n    at HapiResponseAdapter.handle (/usr/share/kibana/src/core/server/http/router/response_adapter.js:81:17)\n    at Router.handle (/usr/share/kibana/src/core/server/http/router/router.js:164:34)\n    at process._tickCallback (internal/process/next_tick.js:68:7)"},"url":{"protocol":null,"slashes":null,"auth":null,"host":null,"port":null,"hostname":null,"hash":null,"search":null,"query":{},"pathname":"/_opendistro/_security/saml/acs","path":"/_opendistro/_security/saml/acs","href":"/_opendistro/_security/saml/acs"},"message":"Internal Server Error"}
{"type":"response","@timestamp":"2021-07-21T22:23:49Z","tags":[],"pid":8834,"method":"post","statusCode":500,"req":{"url":"/_opendistro/_security/saml/acs","method":"post","headers":{"host":"elastic-stack.enseva-labs.net:5601","connection":"keep-alive","content-length":"16027","cache-control":"max-age=0","sec-ch-ua":"\" Not;A Brand\";v=\"99\", \"Google Chrome\";v=\"91\", \"Chromium\";v=\"91\"","sec-ch-ua-mobile":"?0","upgrade-insecure-requests":"1","origin":"null","content-type":"application/x-www-form-urlencoded","user-agent":"Mozilla/5.0 (Windows NT 10.0; Win64; x64) AppleWebKit/537.36 (KHTML, like Gecko) Chrome/91.0.4472.124 Safari/537.36","accept":"text/html,application/xhtml+xml,application/xml;q=0.9,image/avif,image/webp,image/apng,*/*;q=0.8,application/signed-exchange;v=b3;q=0.9","sec-fetch-site":"cross-site","sec-fetch-mode":"navigate","sec-fetch-dest":"document","accept-encoding":"gzip, deflate, br","accept-language":"en-US,en;q=0.9"},"remoteAddress":"10.200.6.67","userAgent":"Mozilla/5.0 (Windows NT 10.0; Win64; x64) AppleWebKit/537.36 (KHTML, like Gecko) Chrome/91.0.4472.124 Safari/537.36"},"res":{"statusCode":500,"responseTime":88,"contentLength":9},"message":"POST /_opendistro/_security/saml/acs 500 88ms - 9.0B"}

@Anthony
So it seems I can get redirected to keycloak and back to ELK server. I’m starting to think maybe its my configuration in keycloak is the problem now, but I’m not 100% sure. I am new at this and dont know exactly what to do.

@Anthony

Well… Something good happened.
I had an idea after looking in the log files that the response of ES to Keycloak may have been incorrect.

So I start looking into keycloak. I was able to rid of error “500” and then received error “400”.
Assuming I could be on the right path to figuring this out.

After you mentioned about enabling logs this actually lead me to this error was.

/_opendistro/_security /saml/acs 400

Inwhich lead me here.

https://github.com/nextcloud/user_saml/issues/222#issuecomment-402542562

By enabling this button ( Red Box) it worked.

To sum it up.
The Order needed to be corrected under Auth section in config.yml file.
Proper URL in the SAML section of config.yml file need to be adjusted.
“change the challenge flag in basic auth from true to false”
Adding logger.token.name & logger.token.level to log4j2.properties file to resolve errors.
Keycloak need adjusting in the Mapper section of the “Client”.

@Anthony Thank you for you time and patients.

2 Likes

Sorry for bringing up an old thread, but since this was the most informative thread on the issues I had I though I’d share here. I have Opensearch running in kubernetes using the official Helm chart, and was trying to set up SSO with keycloak (also official helm). I had tried multiple things, so here’s what I had to figure out:

  1. The failed parsing SAML config happened when my config files didn’t load properly. As previously mentioned, you have to run the securityadmin.sh to reload them. I was deleting and recreating the helm distros but that’s not enough, because the configs persist in volumes and won’t update unless you also delete the volumes. If you are running k8s, you can exec into the pod and find the .sh at ‘~/plugins/opensearch-security/tools/securityadmin.sh’. Running that worked for reloading the config, but lead to issue 2;

  2. The helm chart mounts the entire ‘data’ dir by default. This was not obvious, but if you declare ANY file under securityConfig.config.data, it will by default expect ALL of them to be declared. If not, it will fail to load your config. I had to look at the code to realize that and noticed that the ‘dataComplete’ flag on the helm chart, if set to false, makes it so each key is mounted independently. This is ideal if you want to load one of the configuration files (eg. config.yml) while keep the other default ones. This is enabled by default, setting it to ‘false’ allowed my configuration to load correctly.

  3. Using signed saml requests requires exporting a key from Keycloak to use with Opensearch (you could generate it other ways, it’s just easier since keycloak does it for you). Under you SAML client, in the “keys” tab, make sure ‘Client signature required’ is enabled and export the key generated by keycloak. That key can be exported with PKCS#12. I then converted that key with openssl to PKCS#8, also setting a password which was then used on opensearch. This I then loaded as a k8s secret, mounted that as a file and referenced it in the helm values as ‘signature_private_key_filepath’.

  4. (This was the most frustrating one) The saml signing algorithm in “signature_algorithm” must abide by RFC4051. The Opensearch SAML documentation includes a semicolon at the end that must be removed. The correct signature_value for RSA-SHA256 is “http://www.w3.org/2001/04/xmldsig-more#rsa-sha256”. It doesn’t help that Keycloak throws an error with “SigAlg was null” when SigAlg was not null, but invalid.

To troubleshoot all that I had to enable several logging facilities, which I leave below for reference (to be used in log4j2.properties):

logger.pemkeyreader.name = org.opensearch.security.securityconf.PemKeyReader
logger.pemkeyreader.level = debug

logger.token.name = com.amazon.dlic.auth.http.saml.Token
logger.token.level = debug

logger.saml.name = com.amazon.dlic.auth.http.saml.HTTPSamlAuthenticator
logger.saml.level = debug              

logger.httpheaders.name = org.apache.http.headers
logger.httpheaders.level = debug

logger.httpwire.name = org.apache.http.wire
logger.httpwire.level = debug

logger.ossecurityplugin.name = org.opensearch.security.OpenSearchSecurityPlugin
logger.ossecurityplugin.level = debug

logger.reindex.name = org.opensearch.index.reindex
logger.reindex.level = debug
logger.reindex.layout.type = PatternLayout
logger.reindex.layout.pattern = [%d{ISO8601}][%-5p][%-25c{1.}] [%node_name]%marker %m%n

appender.console.type = Console
appender.console.name = console
appender.console.layout.type = PatternLayout
appender.console.layout.pattern = [%d{ISO8601}][%-5p][%-25c{1.}] [%node_name]%marker %m%n

rootLogger.level = info
rootLogger.appenderRef.console.ref = console
1 Like

Thanks for sharing @tsestini